4 min læsning
12/13/2022
Mind The Graph Scientific Blog er beregnet til at hjælpe forskere med at lære, hvordan man kommunikerer videnskab på en ukompliceret måde.
Python er et af de bedste programmeringssprog, der vokser utroligt hurtigt. Forstå de mange fordele, når det kommer til forskning.
Forstå mere om empirisk skrivning, herunder definitionen og hvad det indebærer: kvantitativ forskning, kvalitativ forskning og meget mere.
Lær, hvad parafrasering er, hvordan man parafraserer, og få nogle tips til parafrasering, som vil holde dit arbejde fri for plagiat.
Det er tid til at lære om de aktuelle udfordringer i det videnskabelige samfund, og hvordan de påvirker tilegnelsen af viden.
Fejlene i en forskningsartikel er ofte svære at opdage. I denne artikel kan du læse om de forskellige typer af fejl, og hvordan du undgår dem i din research.
Naturvidenskab er ikke så svært, som du tror, hvis du lærer det på den rigtige måde. Tjek 10 YouTube-kanaler om videnskab for at forbedre din viden.
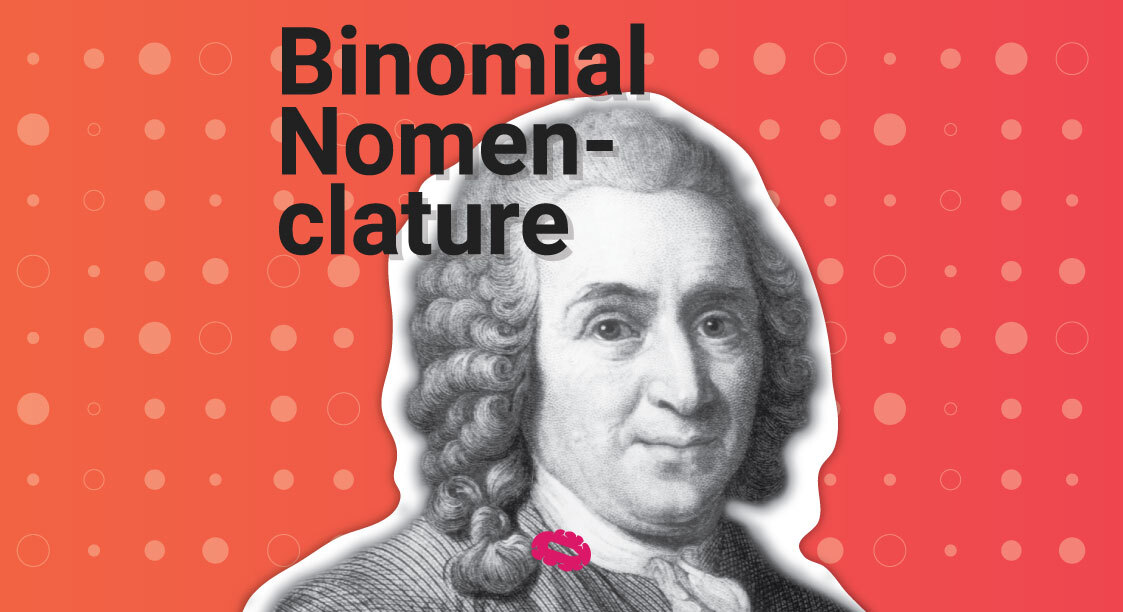
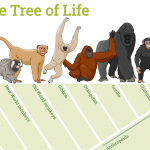
Forstå definitionen af binomial nomenklatur og se på nogle eksempler på binomial nomenklatur fra hverdagen.
Forstå definitionen af binomial nomenklatur og se på nogle eksempler på binomial nomenklatur fra hverdagen.
Lær, hvad en tesebeskrivelse er, og hvordan du skriver en god tesebeskrivelse, der opsummerer hovedideen i dit essay.
Lær om context statements, og hvordan de kan hjælpe dig med at blive optaget på din kandidat- eller ph.d.-uddannelse.
Afhandling og speciale er ret ens og forveksles ofte. Find ud af, hvad forskellen er på dem i denne letlæselige artikel.
Plagiat og krænkelse af ophavsretten er to vidt forskellige former for tyveri. Lær typerne af uetisk brug og de vigtigste forskelle.
Denne Mind The Graph-guide har til formål at lære dig, hvordan du laver citationer på den enkleste måde ved hjælp af APA-formatering.