Enhance Findings With Figures: Visualizing Insights In Research
Master Scientific Data Visualization. Learn how to make data easier, unlock insights and captivate audiences effectively.
This category contains all you need to know about science design for research papers.
Master Scientific Data Visualization. Learn how to make data easier, unlock insights and captivate audiences effectively.
We’ve released an upgrade to our workspace to make your experience creating science designs even better. Here, we will show you all the news.
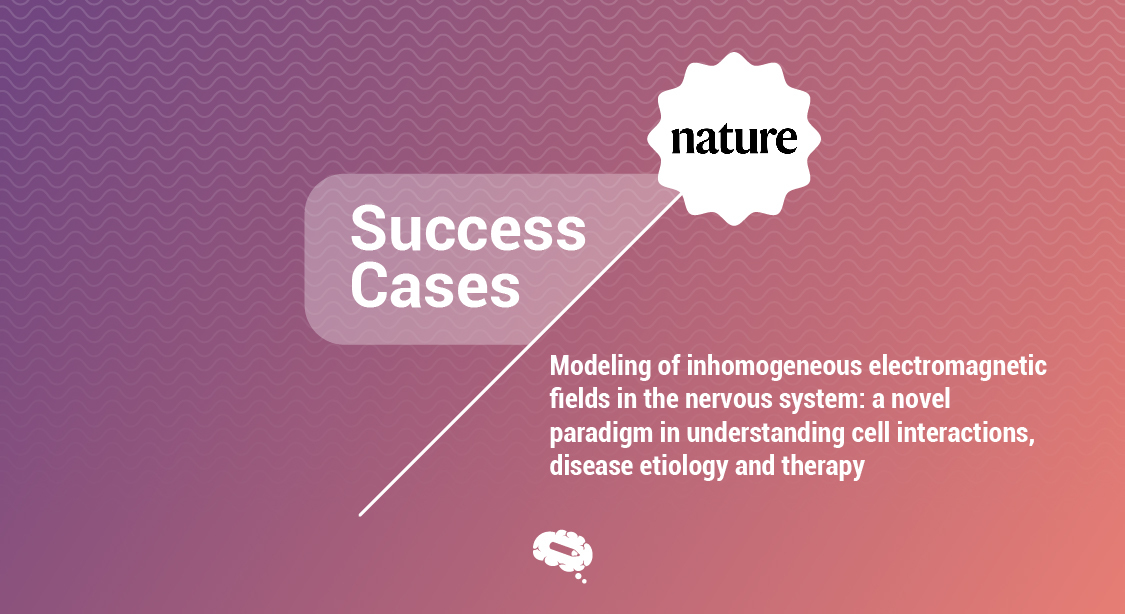
Learn with the ones who already discovered the power of infographics. This article has graphical abstracts made with Mind the Graph.
Learn with the ones who already discovered the power of infographics. This article has graphical abstracts made with Mind the Graph.
This article has scientific illustrations made with Mind the Graph to represent nuclear receptors in liver fibrosis.
Learn with the ones who already discovered the power of infographics. This article has graphical abstracts made with Mind the Graph.
It could be a little difficult to explain the crotoxin’s anti-inflammatory modulation without the proper images, but Mind the Graph exists!
The Disabled spheroid and organoid formation by FGFR-inhibition in patient-derived CRC cells are easier to understand with our illustrations.
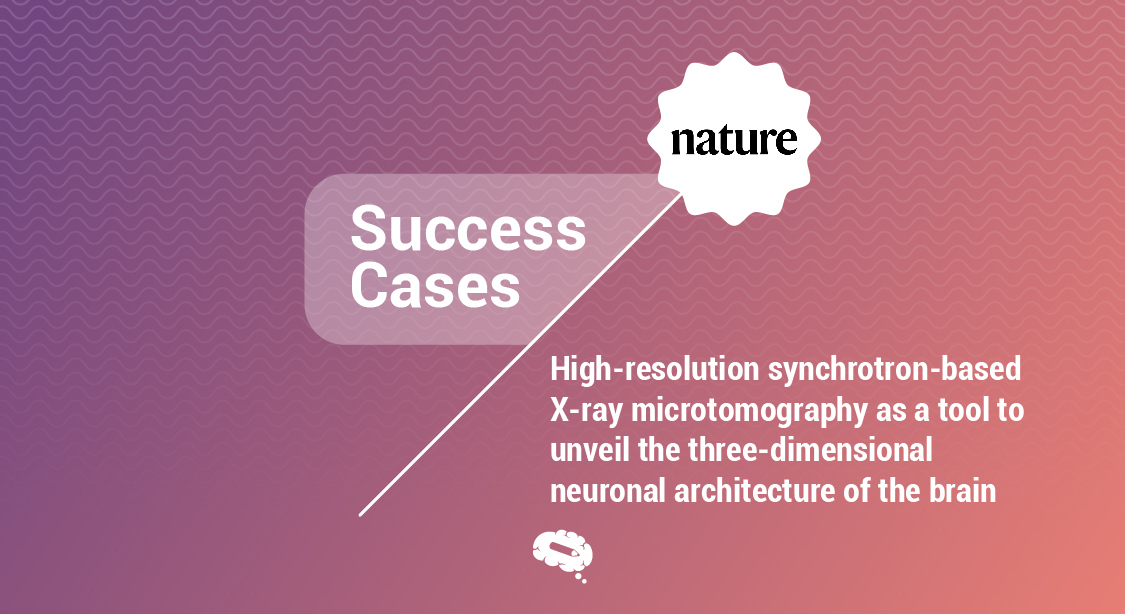
Look into the new method for deciphering the cytoarchitecture and connectivity of the brain represented with Mind the Graph’s illustrations.
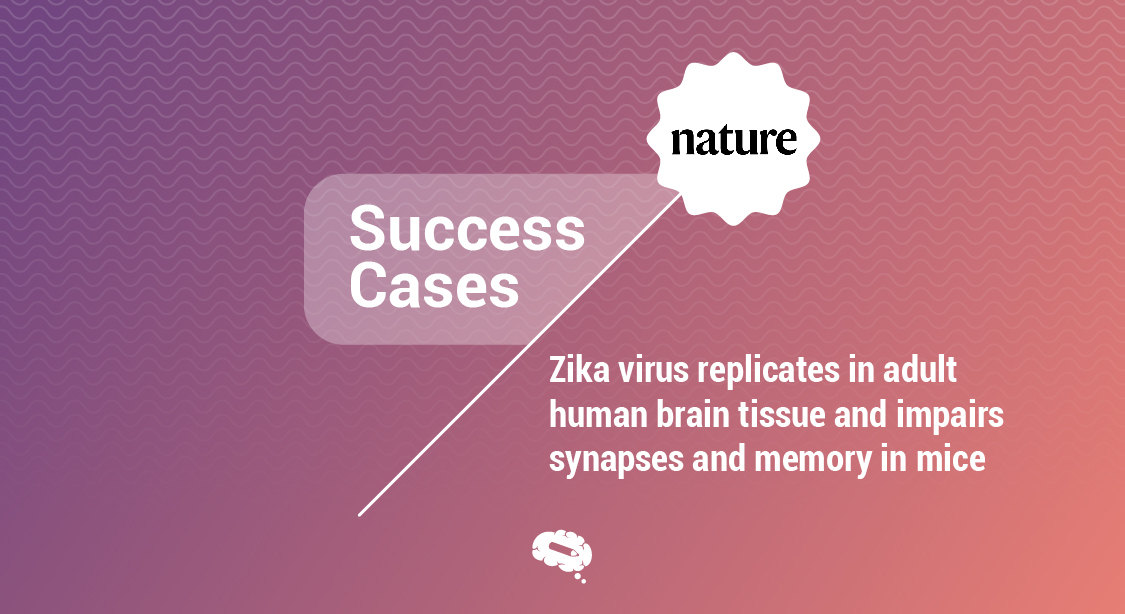
The study is about ZIKV in the adult human brain, a dangerous virus that ravages the world. The process uses Mind the Graph illustrations.
The infographic made with Mind the Graph explains Psychedelic-Assisted Psychotherapy mapped onto the triple-axis psychiatric crisis.
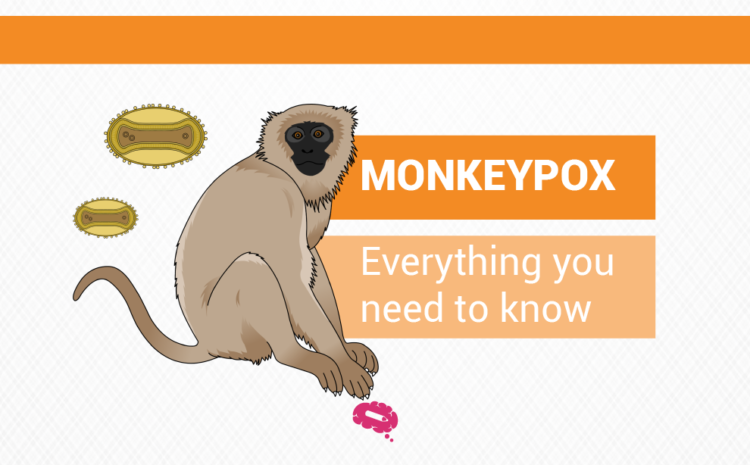
In this article, we take a look at what monkeypox is and how to identify its symptoms and recommend steps to prevent it.
No time to create an award-winning scientific poster? This article will show you how to make a good one in minutes, not hours.