In today’s digital world, where information is everywhere, finding a platform that not only shares knowledge but also makes data exciting can be tough. That’s where Mind the Graph comes in. It’s not just for scientists or professionals—it’s for anyone who wants to make their information stand out. Let’s take a look at these 13 advantages of Subscribing to Mind the Graph to understand why this tool is a game-changer for everyone who loves beautiful and accurate visuals.
Affordable Price
Mind the Graph offers several premium features in prices that fit every budget. From early-career students to renowned laboratory leaders and corporate directors, Mind the Graph is surely the perfect solution for creating visuals for your work with plans starting from 9 USD monthly.
World’s Largest Scientifically-Accurate Illustration Gallery
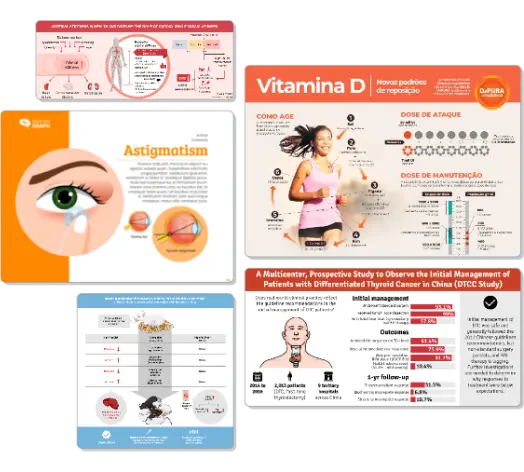
We are proud to say that Mind the Graph has the largest scientifically-accurate illustration gallery in the world, with more than 75,000 options available in +80 fields of study. From biology and medicine to chemistry, physics, and beyond, our library is meticulously curated to cater to the needs of researchers, educators, and professionals across various disciplines. With each illustration crafted with precision and attention to detail, users can confidently enhance their presentations, publications, and educational materials with visually engaging content that accurately represents scientific concepts and data.

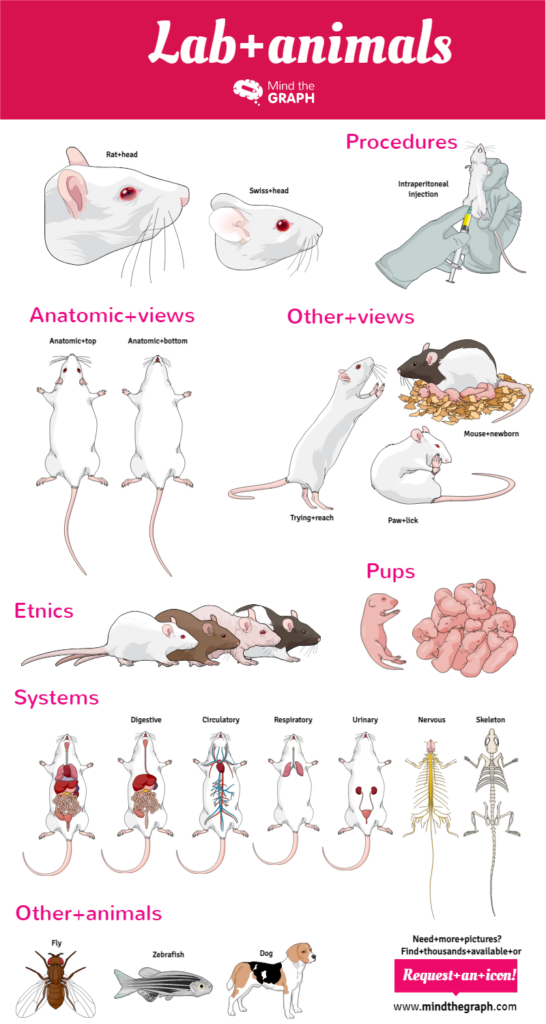

Infographic Templates Available In Our Gallery!
Custom Illustration Request
In case you haven’t found an illustration that fits your needs in Mind the Graph’s gallery, we’ll design it for you. You only need to send us your references and the illustration will be available within 7 days. Our dedicated team of skilled designers and scientists collaborate closely with you to understand your specific requirements and ensure that the custom illustration meets your exact specifications. Whether it’s a complex biological process, a unique chemical structure, or a specialized scientific concept, we are committed to providing tailored solutions that exceed your expectations. Additionally, our streamlined process ensures prompt delivery, allowing you to focus on your work without any unnecessary delays.

Content Curated By Scientists
For us, accuracy is paramount. That’s why all illustrations available at Mind the Graph are curated by a global network of scientists. Every scientific illustration undergoes a rigorous process, meticulously designed by professionals and rigorously vetted by specialists in each area. Our team ensures that each visual representation not only meets the highest standards of scientific accuracy but also effectively communicates complex concepts clearly and engagingly. By leveraging the expertise of experts across various fields, we guarantee that our illustrations are not only visually appealing but also scientifically sound, empowering users to confidently utilize them in their research, presentations, and educational materials.
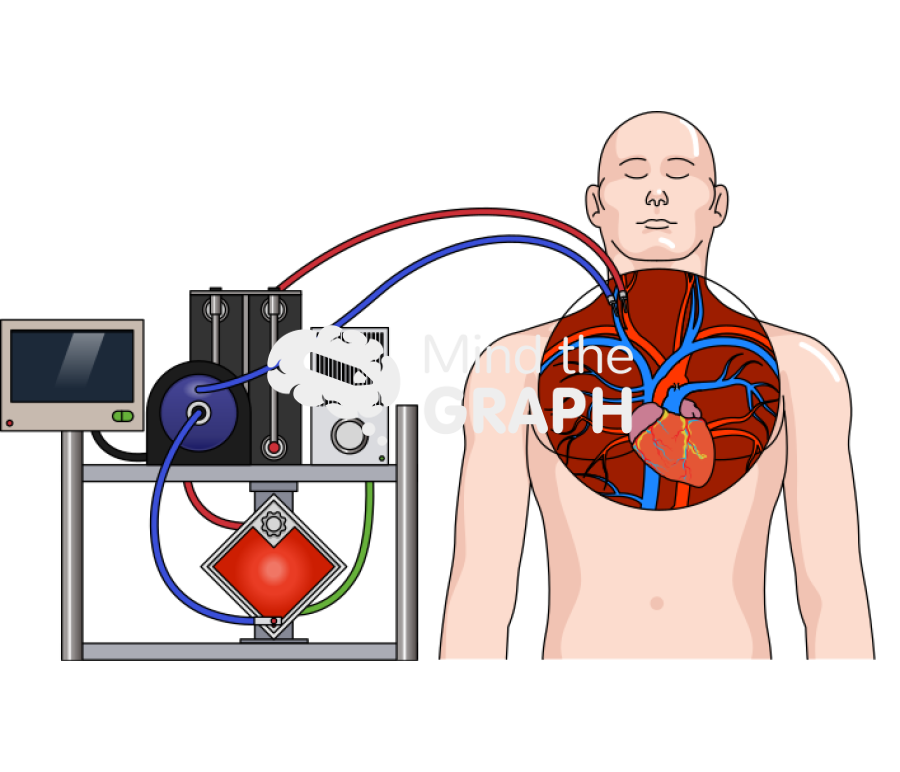
The following image is one among many other good examples of accuracy. It shows Ecmo Equipments Surgery Heart Circulatory System Front. Available in our gallery.
User-Friendly Interface
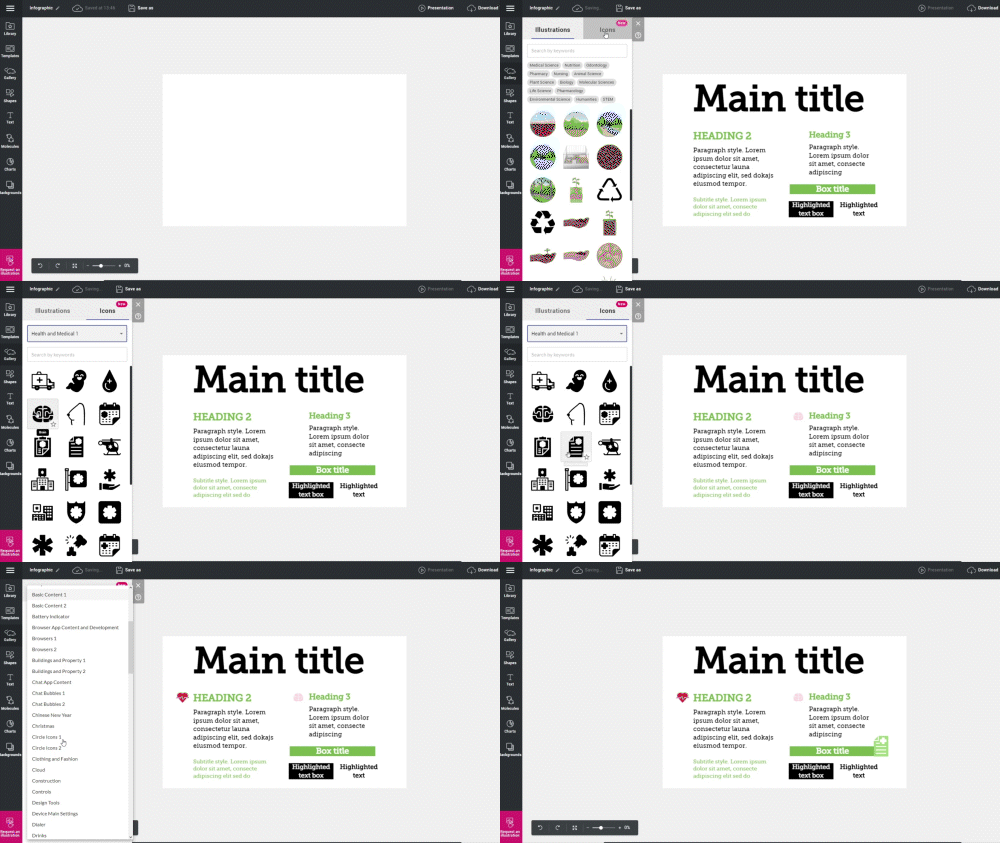
Mind the Graph offers a user-friendly interface in which you can easily create stunning visuals in minutes – no design skills needed. Our intuitive platform provides a seamless experience, guiding you through the process of visual creation with ease. Whether you’re a seasoned professional or a beginner, you’ll find our tools simple to navigate, allowing you to focus on bringing your ideas to life without any unnecessary complications.
Additionally, our dedicated support team is always on standby to assist you should you encounter any challenges during your design process. With prompt and personalized assistance, we ensure that you receive the support you need to overcome any obstacles and achieve your visual communication goals effectively.
From Scientists To Scientists
Mind the Graph was born from the need for uncomplicated software to create beautiful scientific visuals. The story begins with a neuroscientist who, frustrated by the dearth of accurate images on Google and the countless hours wasted on PowerPoint, joined forces with a talented designer and a skilled software engineer. Together, they embarked on a mission to revolutionize the way scientific visuals are created.
Several years of collaboration and innovation later, mindthegraph.com emerged as the premier tool for generating scientifically accurate visuals in a matter of minutes, streamlining the process that once consumed hours of valuable time. Today, a decade later, Mind the Graph stands as a testament to the power of collaboration and innovation, empowering scientists, educators, and professionals worldwide to communicate their ideas effectively and visually.

Custom Design
On Mind the Graph, you have at your disposal the most effective tools and features to craft beautiful and accurate designs by yourself. But if you have a restrict deadline or even if you don’t want to get your hands dirty, you can also request a custom design. Our team of experts is ready to create beautiful and professional designs like posters, infographics, graphical abstracts, and more, tailored specifically to your needs and preferences. Whether you’re working on a tight deadline or seeking to elevate your visual content with bespoke designs, our team is committed to delivering exceptional results that capture your audience’s attention and effectively convey your message.
With Mind the Graph’s custom design services, you can trust that your visual communication needs are in capable hands, allowing you to focus on what matters most—sharing your research, ideas, and insights with the world.
Permission For Professional Publication
By subscribing to one of the available paid plans, you not only gain access to watermark-free illustrations but also acquire full copyrights, empowering you to publish your work with confidence and authority. With the most beautiful and accurate illustrations in the world at your fingertips, you can effectively convey complex subjects with easily understandable visuals that resonate with your audience.
Whether you’re a researcher disseminating groundbreaking findings, an educator sharing knowledge with students, or a professional communicating insights to colleagues and clients, our platform equips you with the tools you need to reach a greater audience and make a lasting impact. With Mind the Graph, your visual communication efforts are elevated to new heights, ensuring that your message is not only heard but also understood and appreciated by all who encounter it.

+300 Templates To Start From
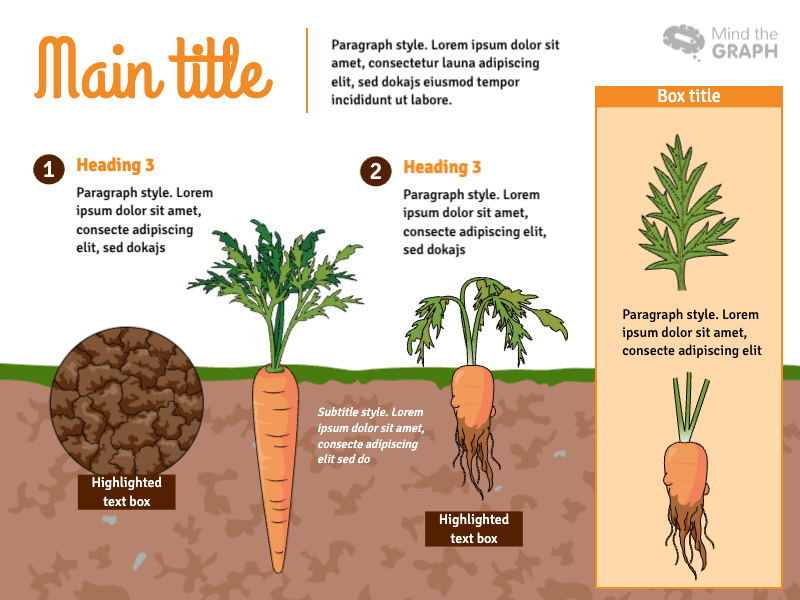
Creating a design from scratch can indeed be a daunting task, but with Mind the Graph, you don’t have to start from square one. We offer more than 300 templates meticulously crafted by our team of designers, providing you with a solid foundation to build upon. Whether you’re creating a poster, an infographic, or a graphical abstract, our templates cover a wide range of styles and purposes, making it easier than ever to find the perfect starting point for your project. Plus, our intuitive editing tools allow you to customize every aspect of the design with ease. From adjusting colors and fonts to adding or removing elements, you have full control over the final look and feel of your visual.
With just a few clicks, you can transform a template into a unique and eye-catching masterpiece that effectively communicates your message. Say goodbye to the hassle of starting from scratch and hello to the convenience and efficiency of Mind the Graph’s template library.
High-Resolution Exports in PNG, PDF, And TIFF
After creating and customizing your visuals, export your designs effortlessly in a variety of formats including PNG, PDF, or TIFF, ensuring compatibility with your preferred publishing platform or presentation software. But the journey doesn’t end there—before submitting your work, it’s crucial to meticulously review and adhere to the specific requirements of your target journal or publication.
By carefully checking and meeting the formatting guidelines, you can significantly increase your acceptance rates and maximize the impact of your research. Mind the Graph not only equips you with the tools to create stunning visuals but also empowers you to navigate the publication process with confidence and ease. With our platform by your side, you’ll be well-equipped to ace any task and share your findings with the world.

Priority Customer Support
Our dedicated team of specialists is committed to ensuring that you have a smooth and successful experience with Mind the Graph. Whether you encounter technical difficulties, need guidance on using specific features, or have questions about best practices for visual communication, we’re here to help. You can easily reach out to us through multiple channels, including our live chat support, WhatsApp, or email (support@mindthegraph.com).
No matter the inquiry, we strive to provide prompt and personalized assistance to address your needs and enhance your overall experience with our platform. Your satisfaction and success are our top priorities, and we’re here to support you every step of the way on your visual communication journey with Mind the Graph.

100% Online Tool
Mind the Graph is more than just a convenient online tool—it’s a versatile platform that empowers you to create, edit, and export beautiful scientific designs from anywhere in the world. Whether you’re at home, in the lab, or on the go, all you need is a desktop or laptop and an internet connection to unleash your creativity and effectively represent your work. Our platform is designed to streamline the process of creating visuals for a variety of purposes, including seminars, conferences, thesis defenses, research publications, and more.
With Mind the Graph, you have the flexibility to work on your projects whenever and wherever inspiration strikes, ensuring that you can meet deadlines and deliver impactful presentations with ease. Say goodbye to the constraints of traditional design software and hello to the freedom and convenience of Mind the Graph.
Data Security
At Mind the Graph, we prioritize the security of your scientific data above all else. We understand the sensitivity and importance of the research and information you entrust to our platform. That’s why we’ve implemented robust security measures to ensure that all visuals you create remain confidential and accessible only to their rightful creators. Our platform is fortified by state-of-the-art encryption protocols, ensuring that your groundbreaking visuals are shielded by a fortress of cutting-edge security.
Additionally, we adhere to strict privacy policies and compliance standards to safeguard your data against unauthorized access or misuse. With Mind the Graph, you can have peace of mind knowing that your valuable research and intellectual property are protected at every step of the way.

Conclusion
In conclusion, the advantages of subscribing to Mind the Graph are clear. The user-friendly platform empowers people from all walks of life to communicate effectively through visually captivating content. Whether you’re a student, a researcher, a teacher, or a professional in any field, Mind the Graph provides the tools you need to make your data shine. Subscribers can elevate their presentations, engage their audiences, and leave a lasting impression. They can do this by embracing the power of visual storytelling. So why wait? Join the Mind the Graph community today and unlock the full potential of your data visualization journey.
Subscribe And Try All Of Them For Yourself
Subscribe now and experience all 13 advantages of Mind the Graph firsthand! Elevate your presentations with stunning visuals, streamline scientific communication effortlessly, and unlock a world of possibilities. Don’t miss out—subscribe today and unleash your creativity!

Subscribe to our newsletter
Exclusive high quality content about effective visual
communication in science.

