How to create professional presentations for scientific conferences
Conferences, seminars and presentations are very common in a researcher routine. But you probably already […]
Conferences, seminars and presentations are very common in a researcher routine. But you probably already […]
Durante os dias 24 e 25 de outubro de 2019, aconteceu no Sindicato das Empresas […]
Visual resources are powerful to communicate better in science. Scientific illustrations are a good example […]
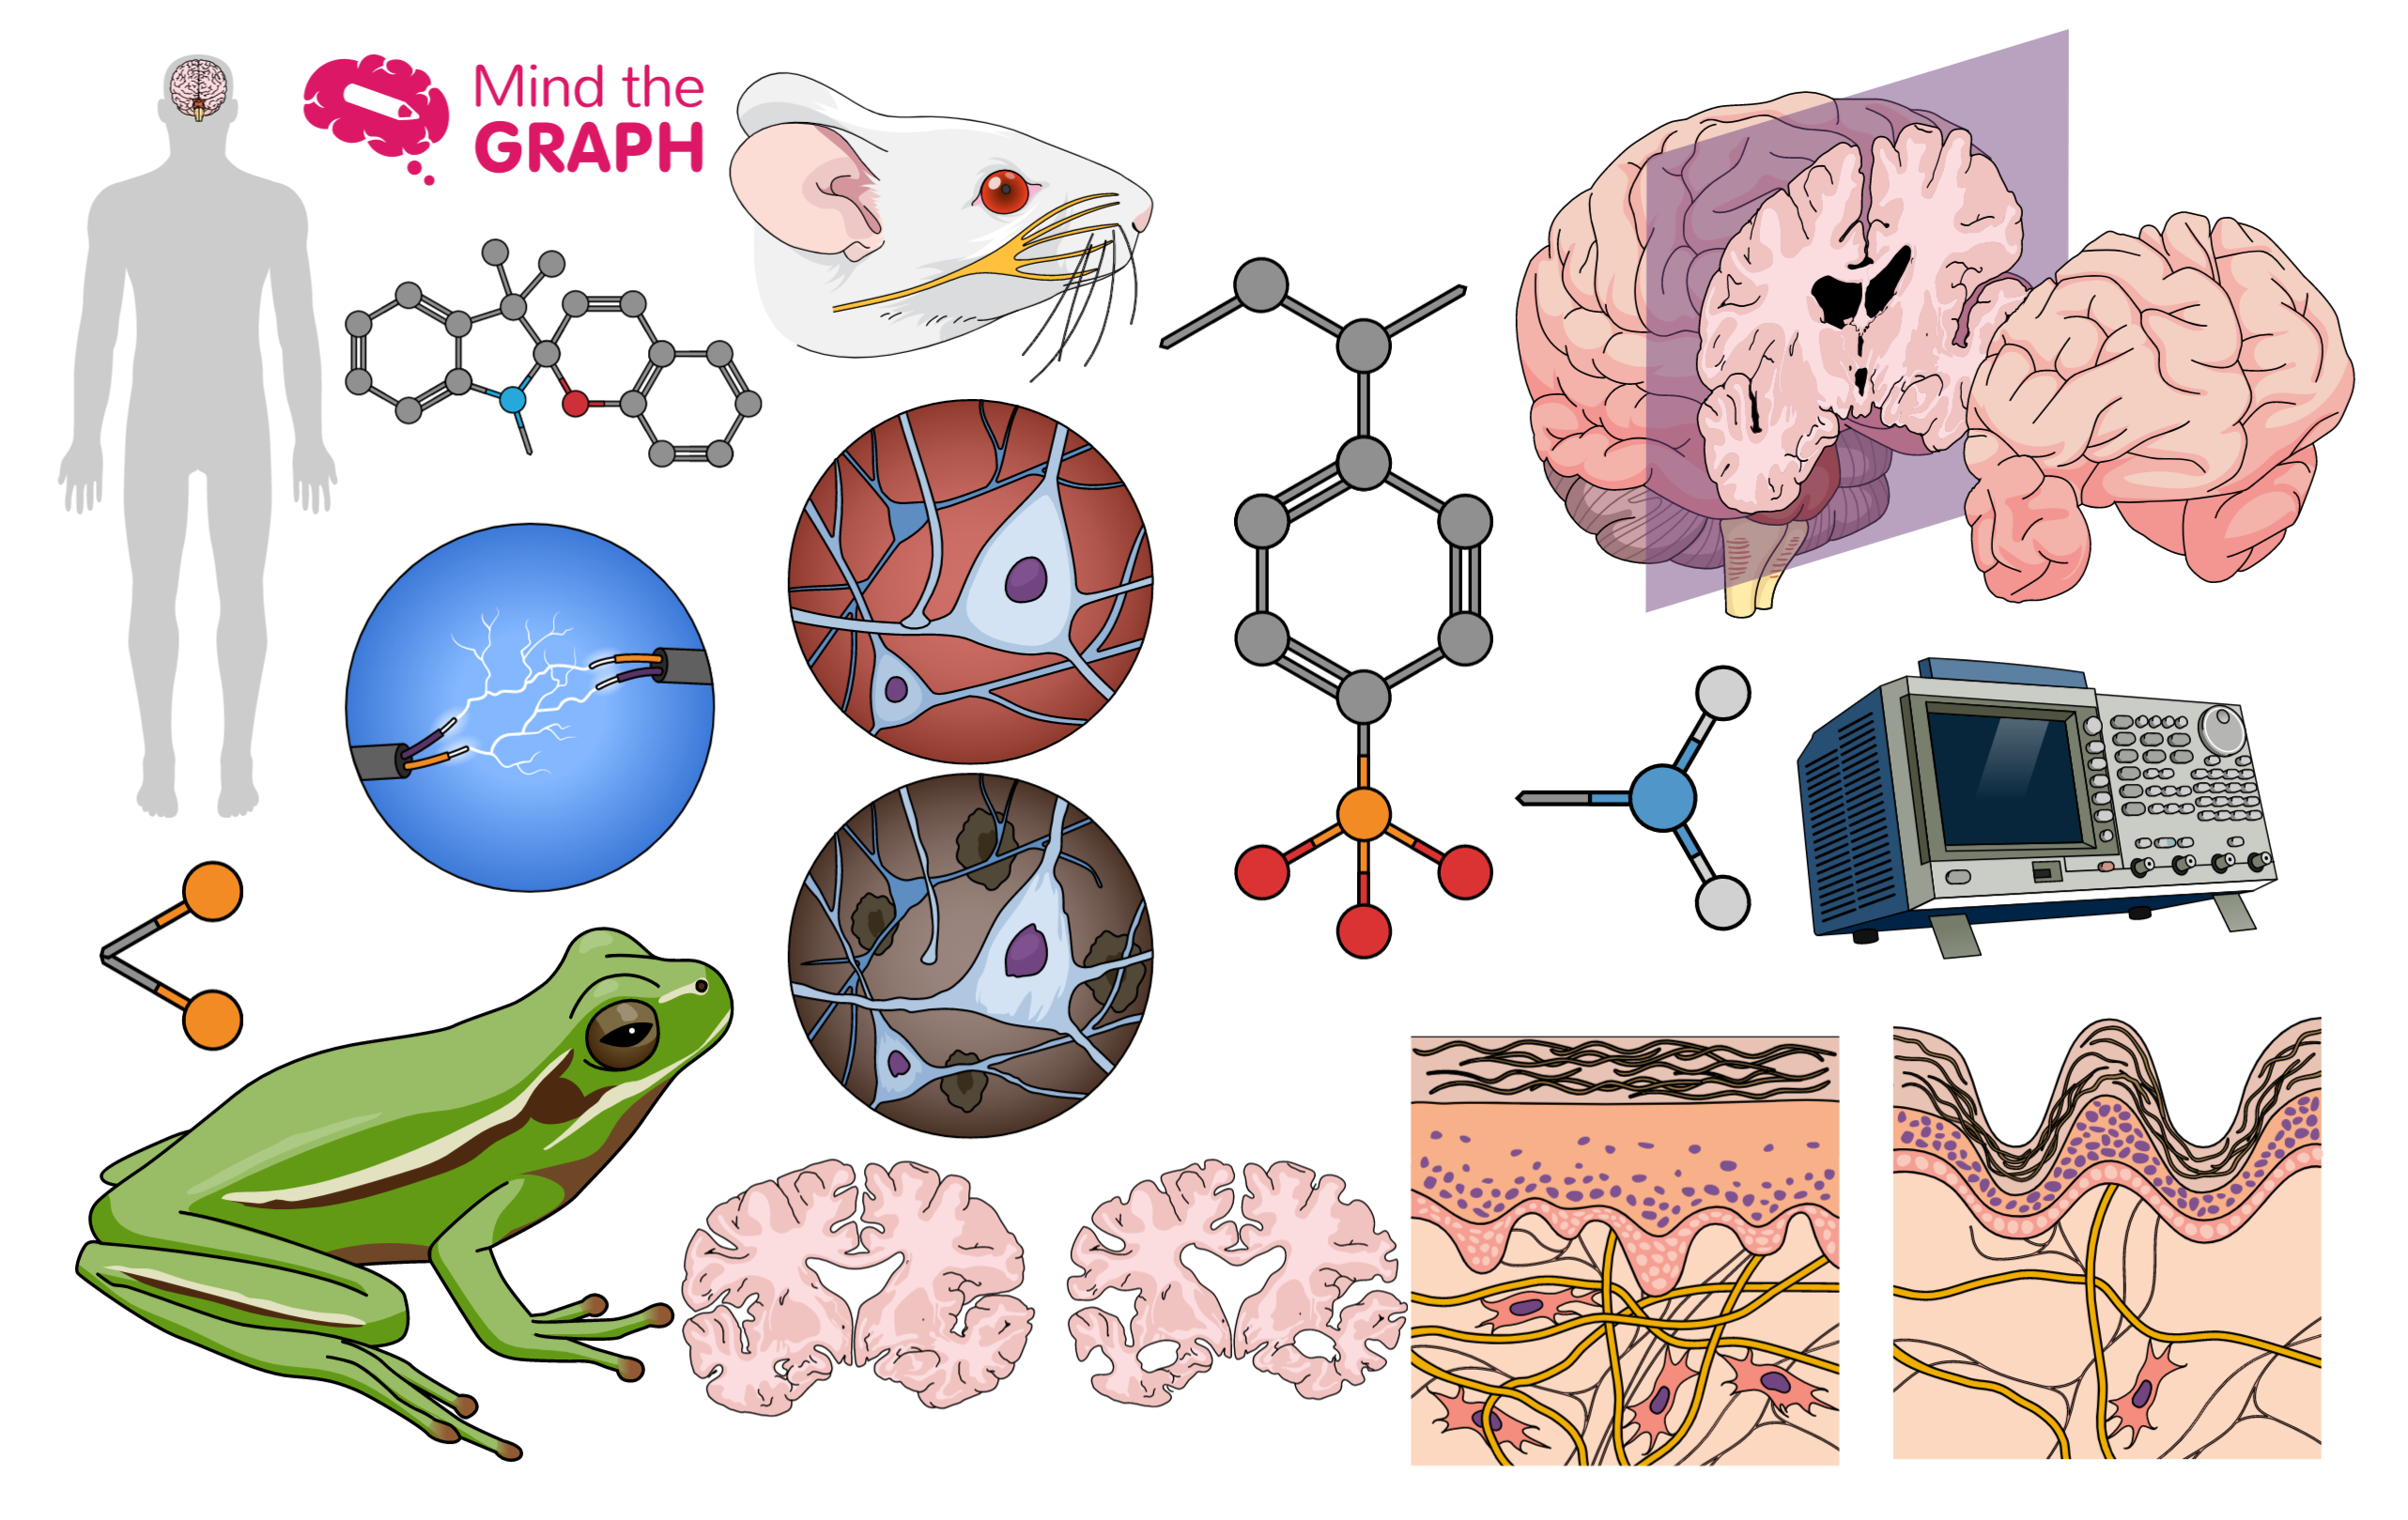
Hi there! Are you ready to see the new scientific illustrations? We have a lot […]
Friday is the day we show off our new scientific and medical illustrations. We already […]
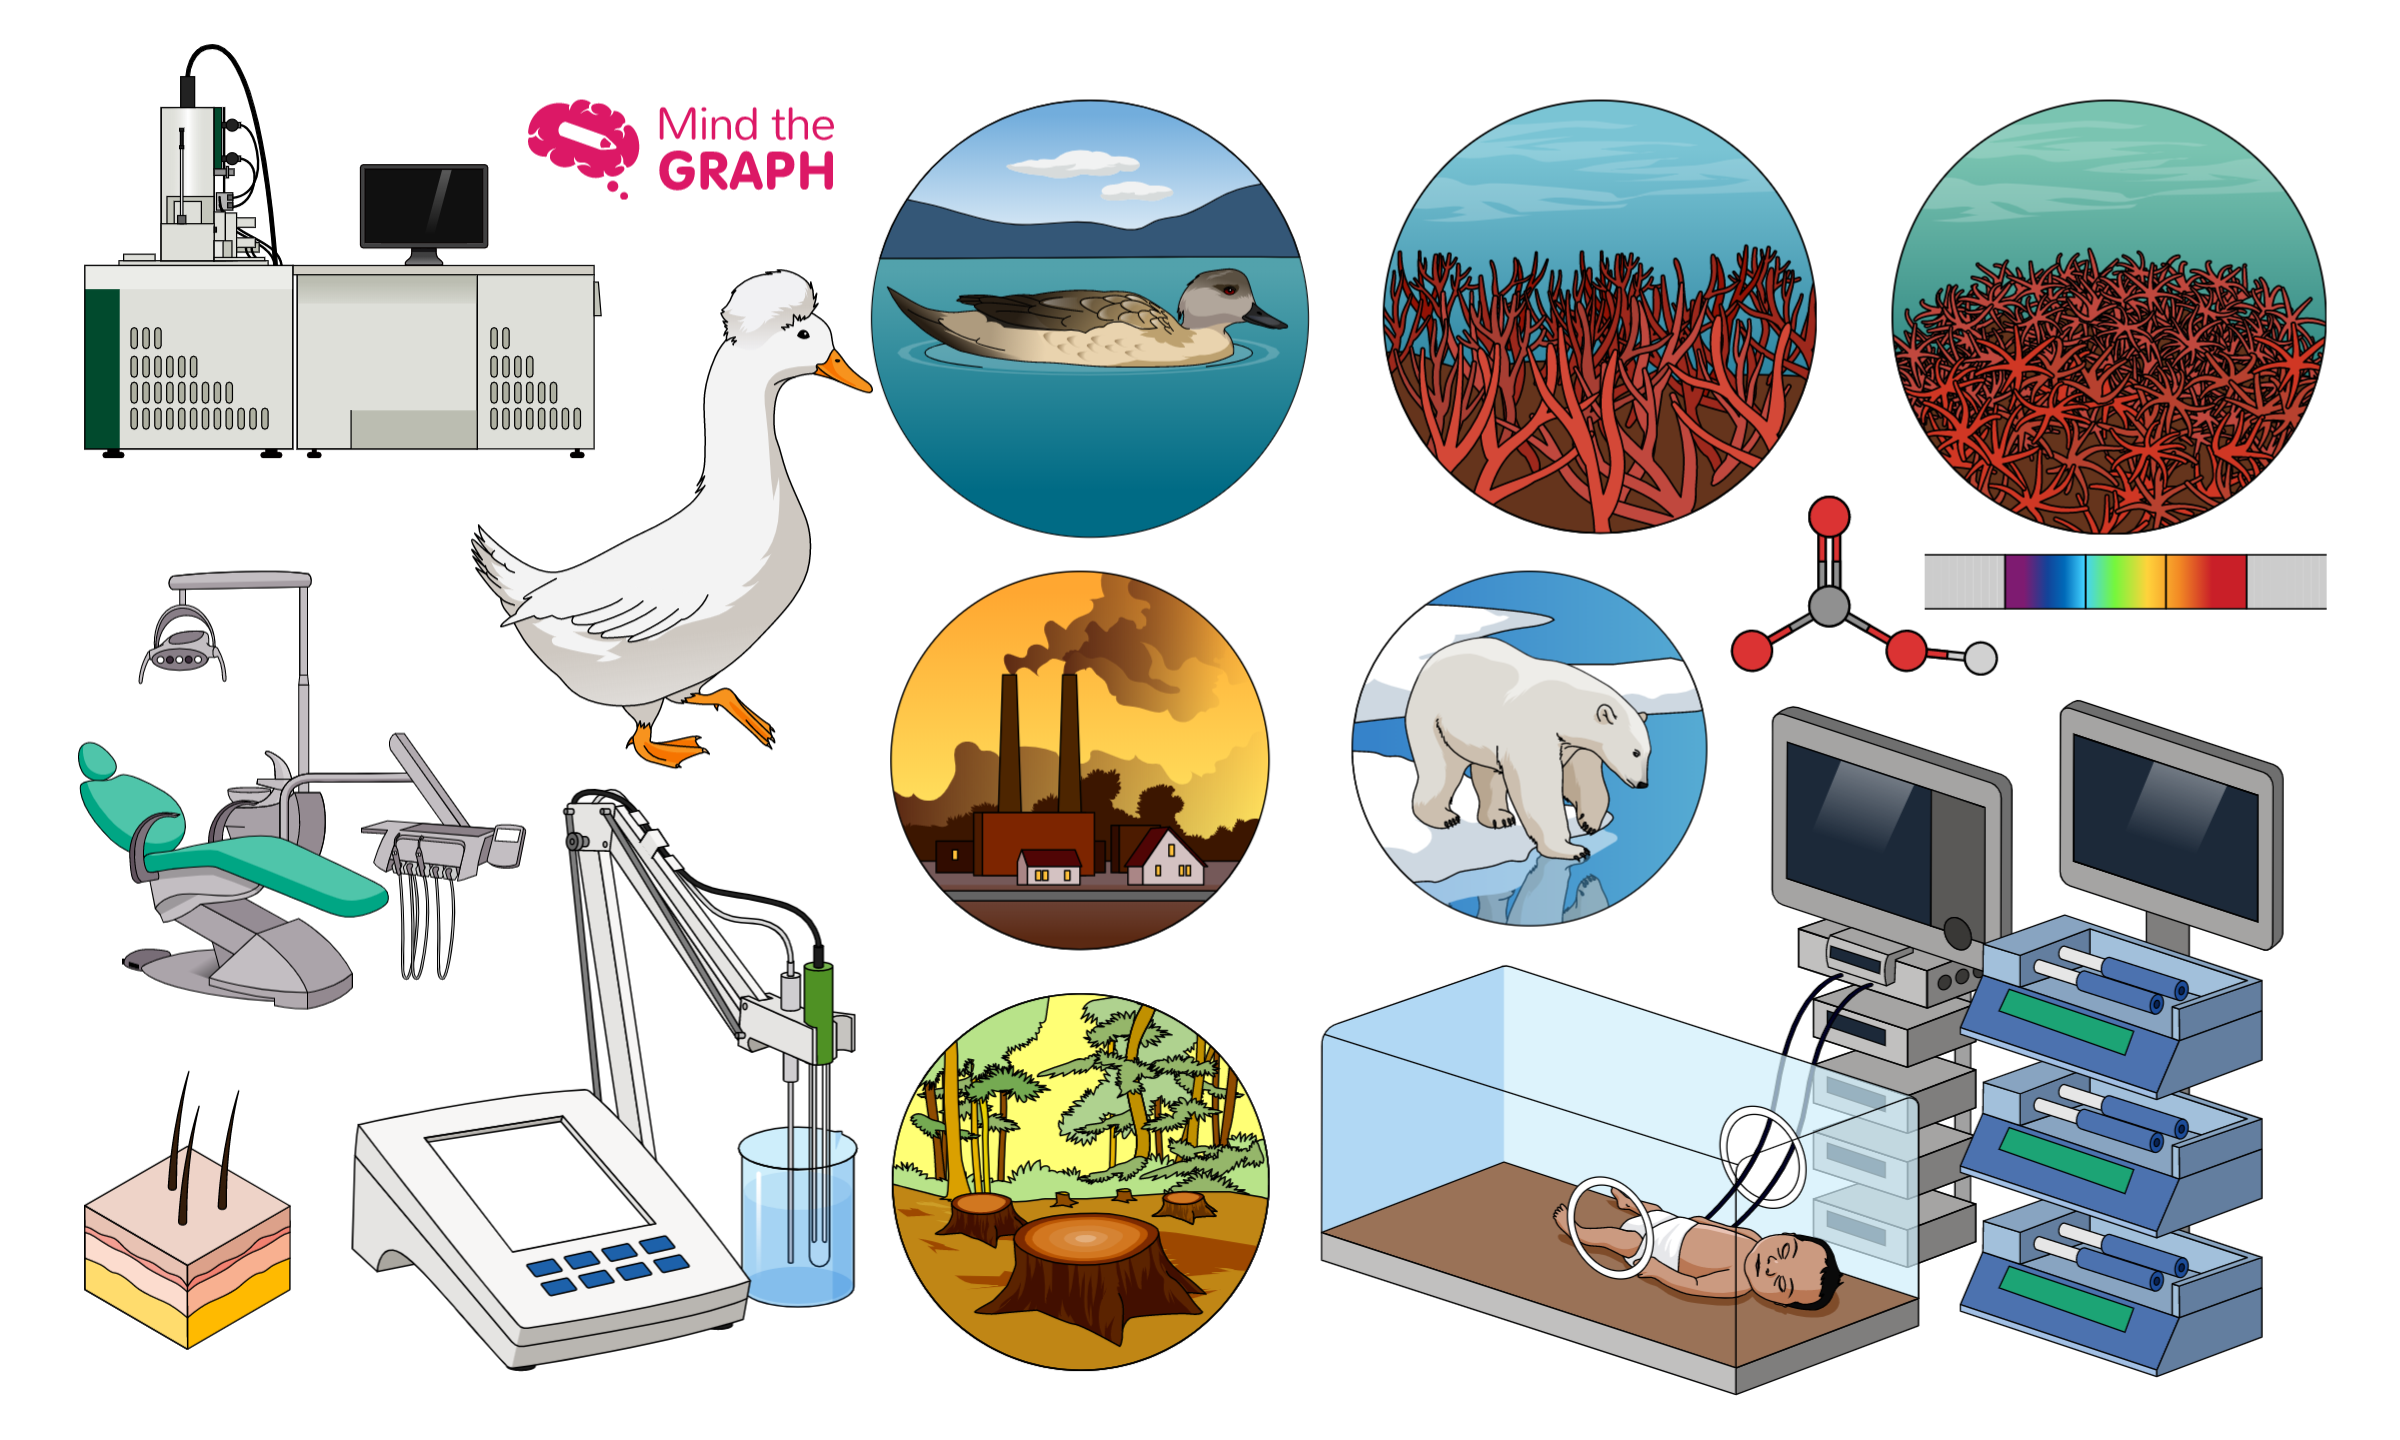
Hello, it is time to show the new Mind the Graph scientific illustrations. We already have […]
To communicate the importance of science in our society, we need first be able to […]
Olá! É sexta-feira novamente (YAY). Você está correndo para o fim de semana? Ou você […]
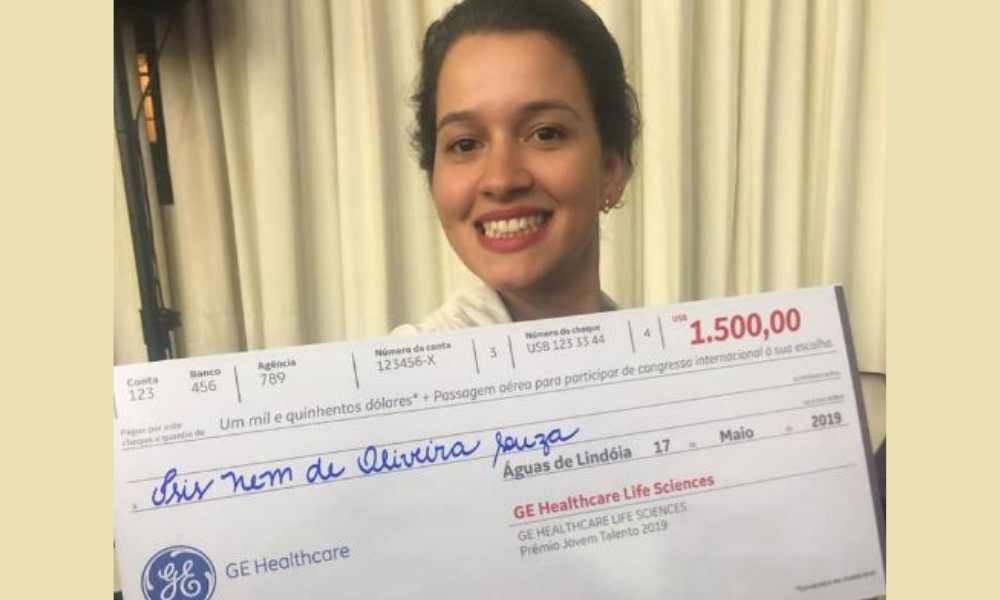
It is always amazing to show the scientific work of our users. So, today I will […]
It’s friday again (YAY), so it’s time to see the new scientific illustrations of the […]
Science must to be about curiosity and questions, not dogmas and canned responses. So, teachers need […]
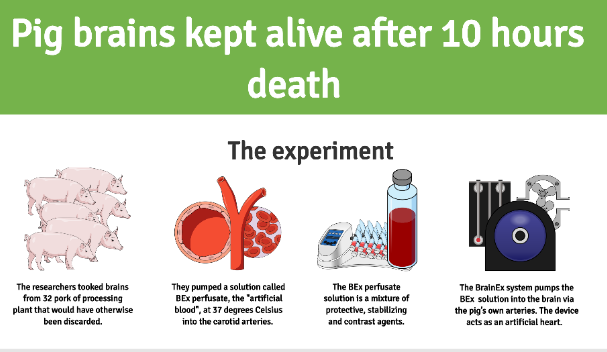
Scientists from Yale University kept pig brains alive outside body for hours after death. The […]
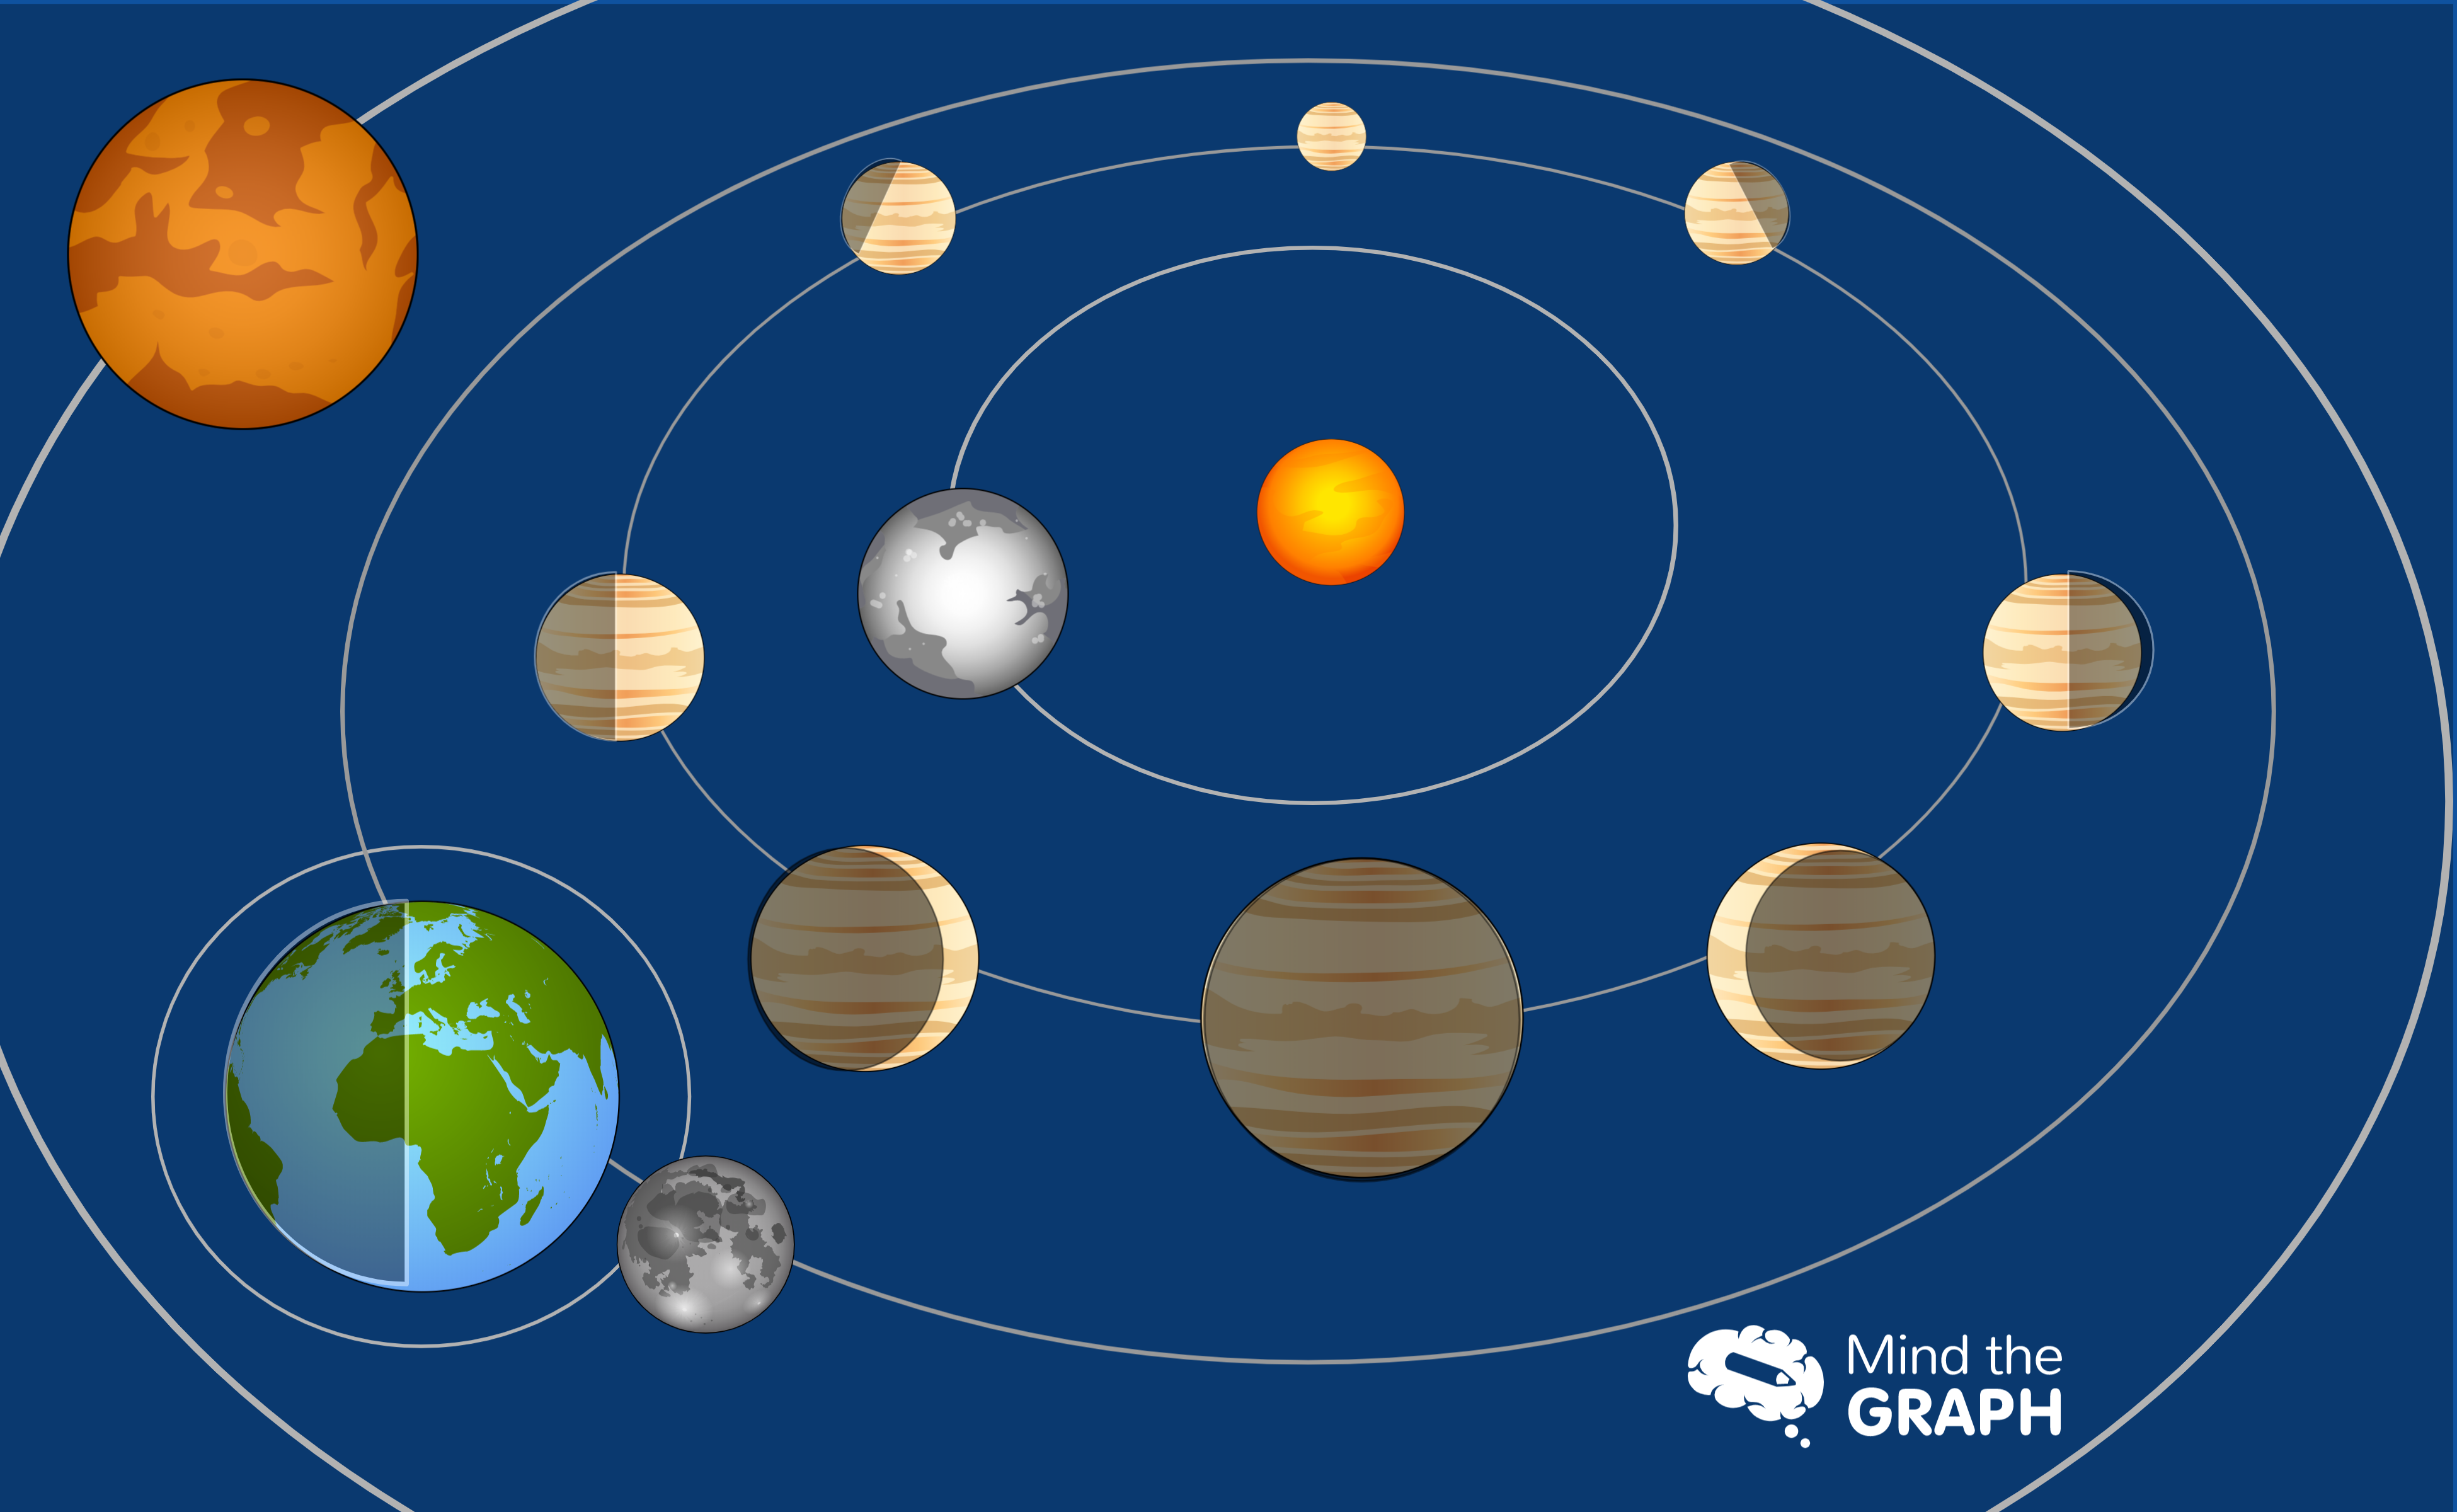
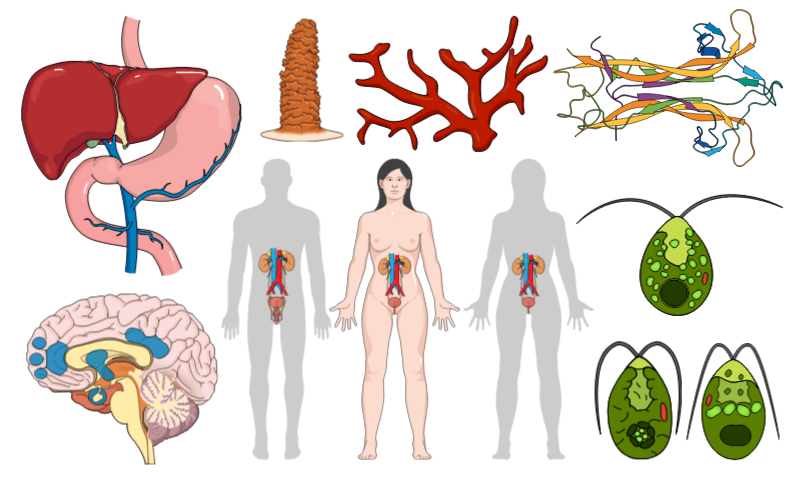
Hello, this week we’ve added amazing new scientific illustrations. All these illustrations are available on […]