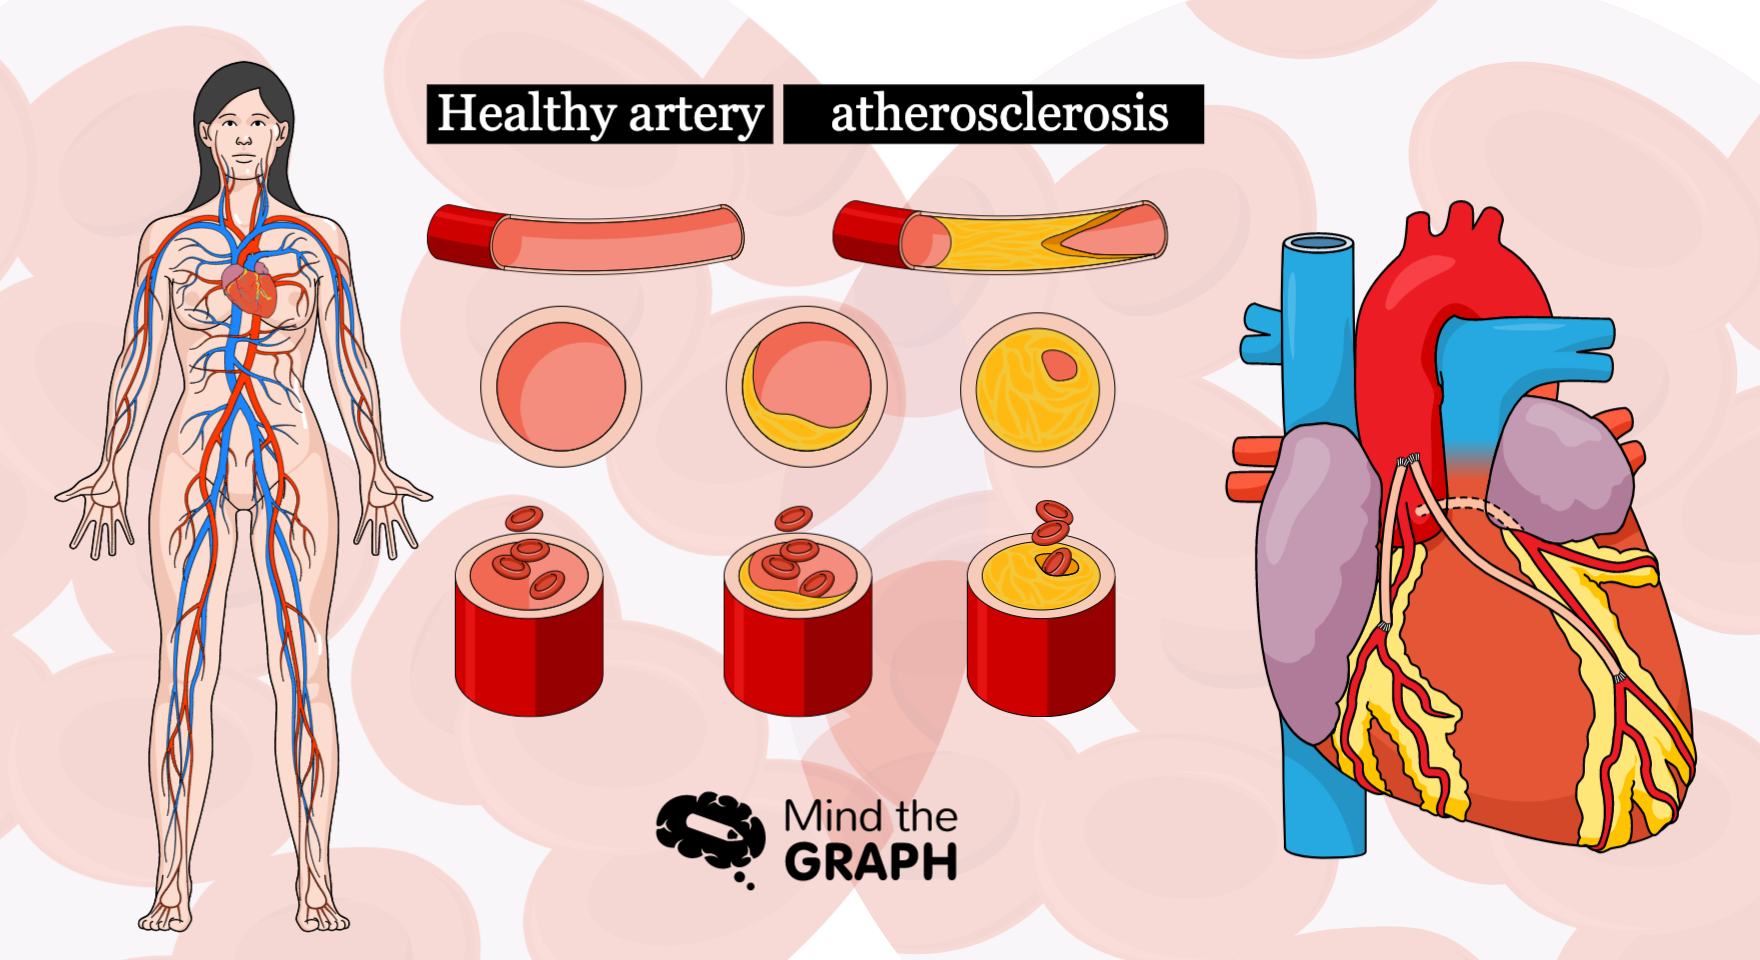
Understanding atherosclerosis through medical illustrations
Atherosclerosis is a medical condition of the circulatory system. It happens when plaque accumulate inside […]
Atherosclerosis is a medical condition of the circulatory system. It happens when plaque accumulate inside […]
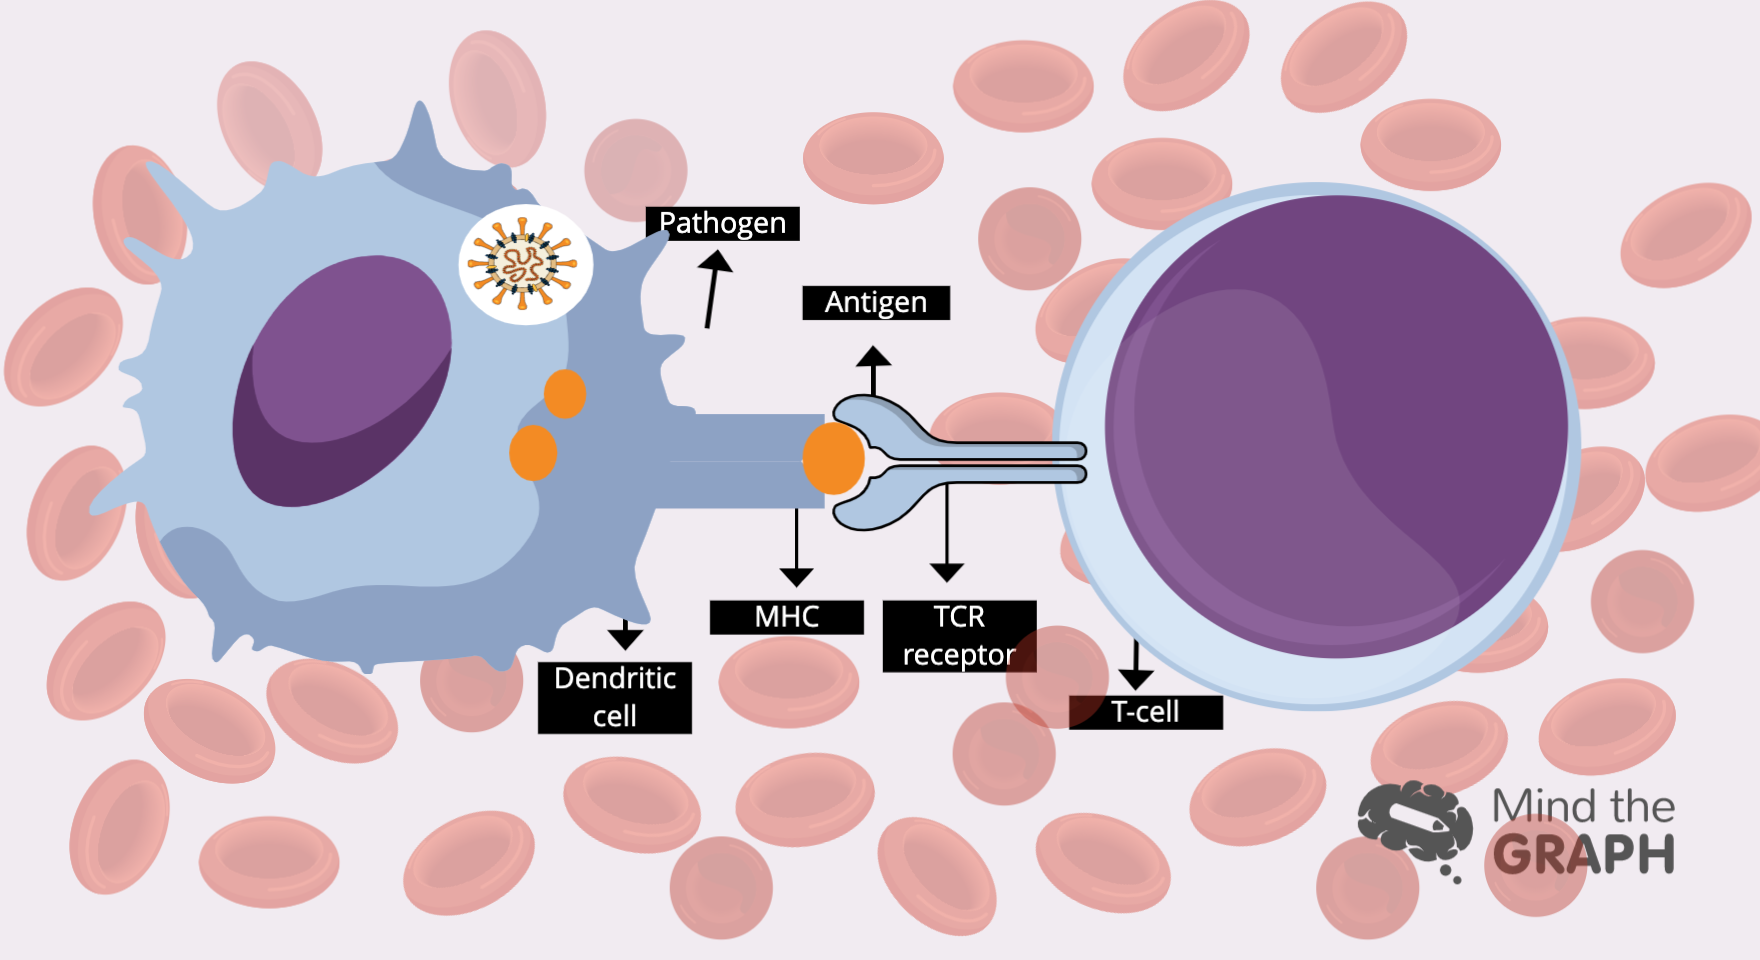
Os glóbulos brancos são responsáveis por defender nosso corpo contra ameaças, mantendo-nos vivos. Mas como […]
Olá! Sexta é dia de mostrar o melhor da nossa semana. Como você deve saber, […]
Yes. The global warming is real. At least according science. This is the short answer. […]