4 min läsning
08/31/2022
Den vetenskapliga bloggen Mind The Graph är tänkt att hjälpa forskare att lära sig hur man kommunicerar vetenskap på ett okomplicerat sätt.
Förstå i denna artikel vad bioetik är, dess betydelse och de olika kategorierna inom olika områden.
Det är dags att lära sig vilka viktiga egenskaper en mentor har, hur de gynnar din karriär eller forskning och hur du kommer i kontakt med dem.
Det är dags att lära sig hur man gör en vetenskaplig tabell för att öka läsbarheten och attraktiviteten i din forskningsrapport.
Lär dig hur en intressekonflikt kan användas i forskning, hur de kan påverka, vilka typerna är och hur man undviker dem.
Det är dags att lära sig vad fekal transplantation är, vem som behöver det, biverkningarna och allt om ingreppet.
Lär dig mer om stamcellsforskning, inklusive fördelar och nackdelar, samt de många olika typer av stamceller som finns tillgängliga.
Nu är det dags att lära sig vad vetenskaplig notation är och hur man skriver tal i den med hjälp av exempel i den här artikeln.
Denna Mind The Graph-artikel lär dig hur du formaterar din forskningsrapport och ger dig några enkla men livsförändrande tips.
I denna lättlästa artikel kan du läsa om många olika sätt att producera en forskningsrapport, hur du korrekt arrangerar och formaterar din forskningsrapport.
Förstå hur en vetenskaplig färgpalett påverkar din vetenskapliga studie, hur du väljer palettfärger och hur du uppnår färgtillgänglighet.
Lär dig hur du skriver en stark och effektiv introduktion till ett forskningspapper genom att följa lämplig struktur och undvika typiska fel.
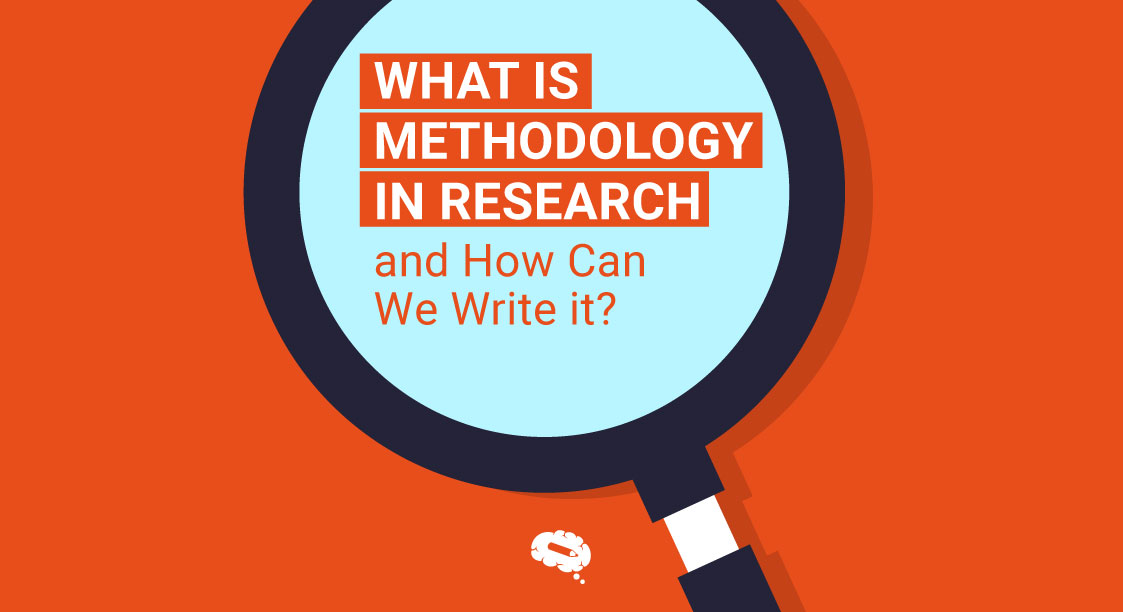
Avhandlingar och forskningsrapporter är ofullständiga utan forskningsmetodik. Lär dig vad det är, varför det är viktigt och hur man skriver en.
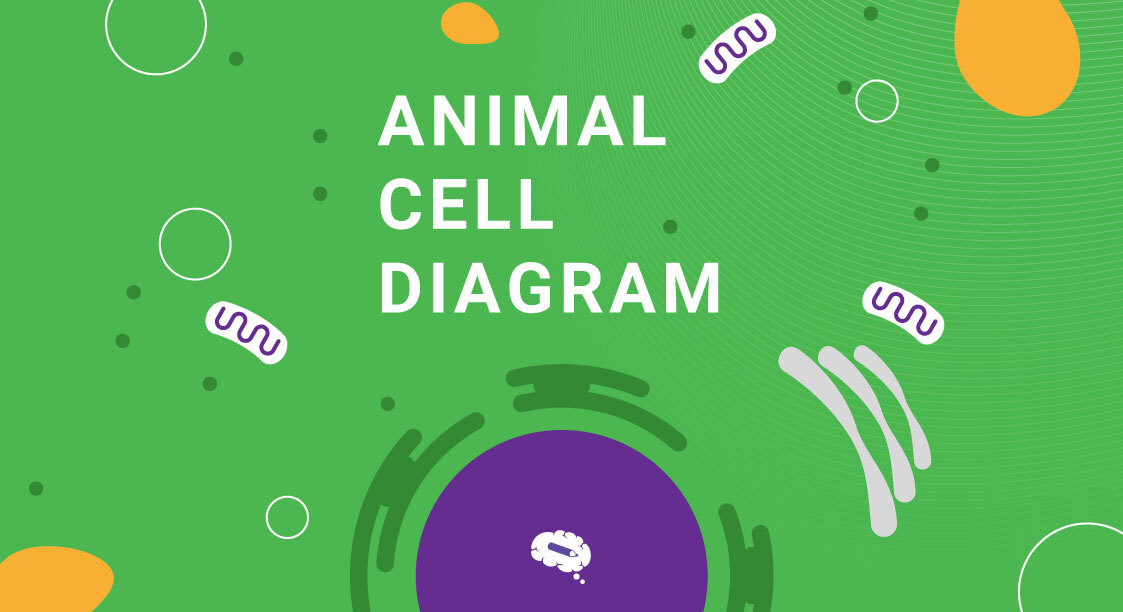
Lär dig vad en djurcell är, dess beståndsdelar och hur man skapar ett användbart diagram för att underlätta den visuella förståelsen.