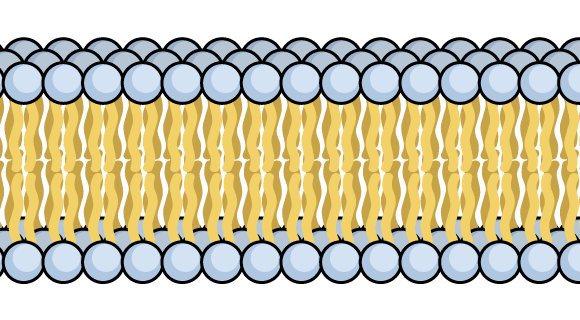
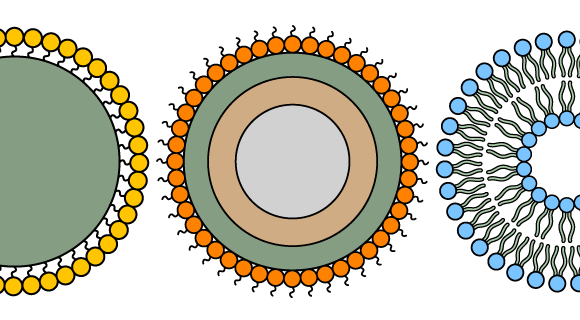
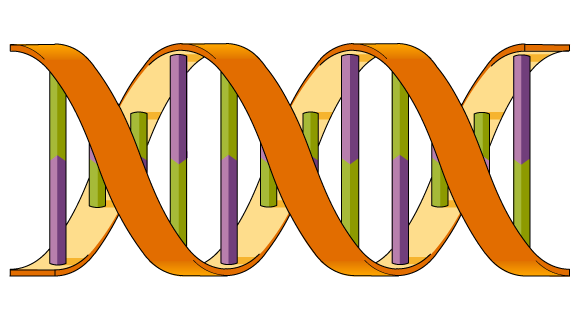
Mind the Graph gave a talk at a Scientific Illustration Congress! If you couldn’t be there, don’t worry. Here is the output:
Hvordan den vitenskapelige verden uttrykker seg
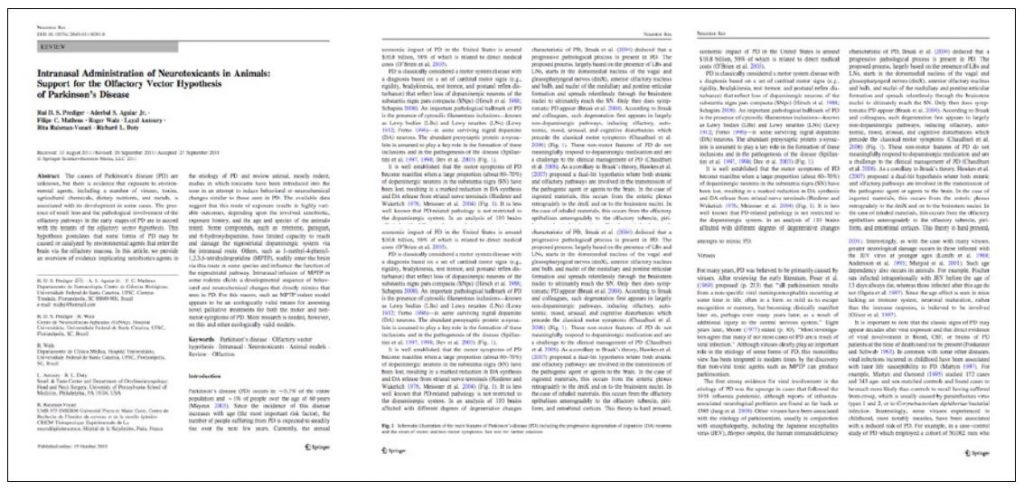
The reality is not good. Most findings are only registered in long and boring papers that will never be read.
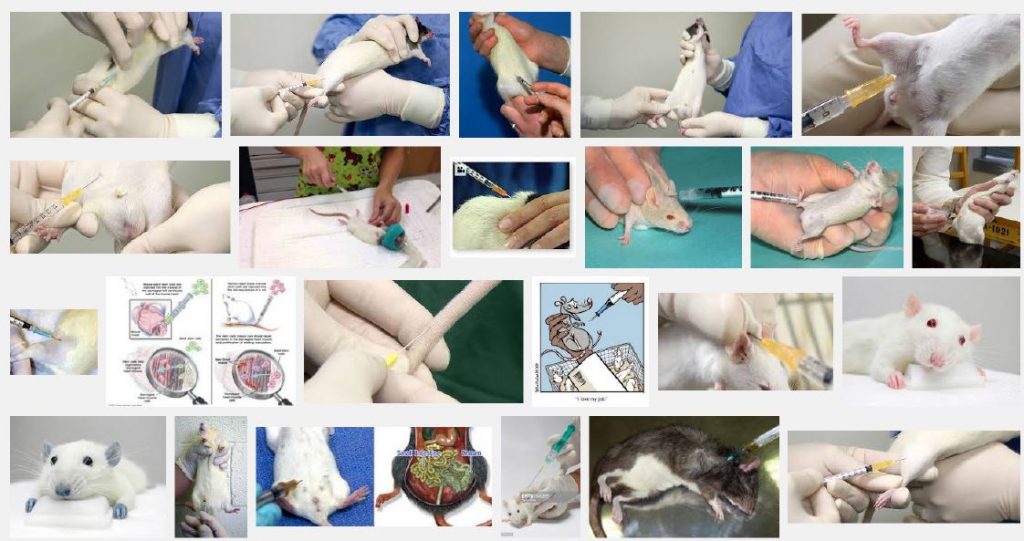
In the meanwhile, if any scientist try to find images to make their findings a little more visual, they have to be satisfied with Google Images since it is very difficult to find scientific illustrations.
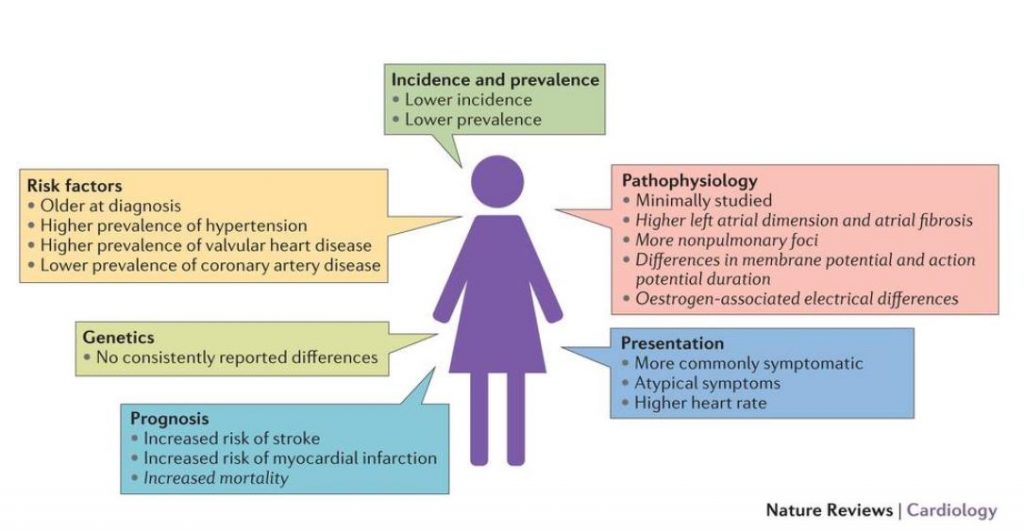
Even the best scientific journals struggle with visual communication. Nature is one of the best journals in science. In fact, at Nature Reviews we can find many examples of translating written data into graphical abstracts. However, some of them could still use some improvements.
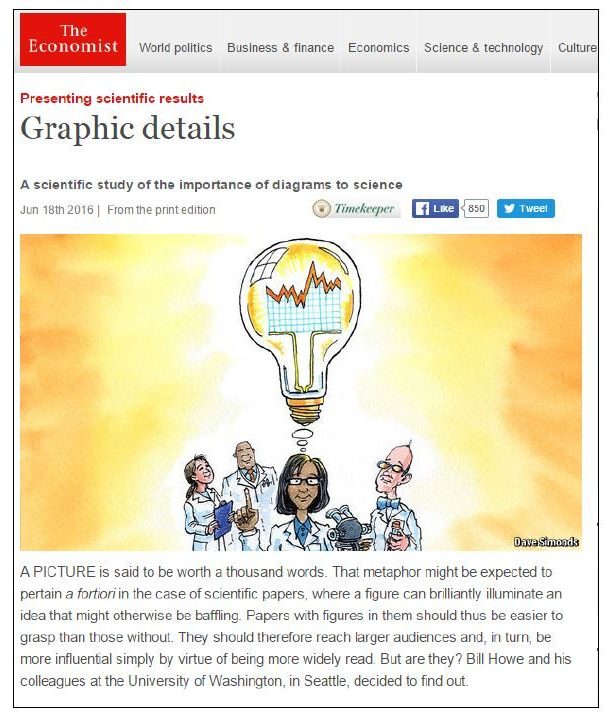
The urge to make science more visual is beheld by the importance papers with graphs or diagrams have. The Economist wrote about the truth behind “A picture is worth a thousand words” saying that graphs and diagrams indeed generate more citations. Which make a lot of sense when you remember the amount of researches published everyday and how we search despairingly for figures everytime we read a new paper.
Vitenskap og visuell kommunikasjon
Siden det er behov for visuell kommunikasjon innen vitenskap, og vi sliter med bildene som er tilgjengelige på nettet, var det behov for et nytt verktøy.
Mind the Graph was created to supply the demand for scientific accurate illustrations. Not only, we still aim to improve science communication and help scientists to get more visibility to their work. However, we are not trying to do it for them. Instead, we want scientists to be 100% capable of building their own graphical abstract, posters, presentations and infographics.
Derfor skapte vi plattformen vår. Fra forskere til forskere.
Vår kreative prosess
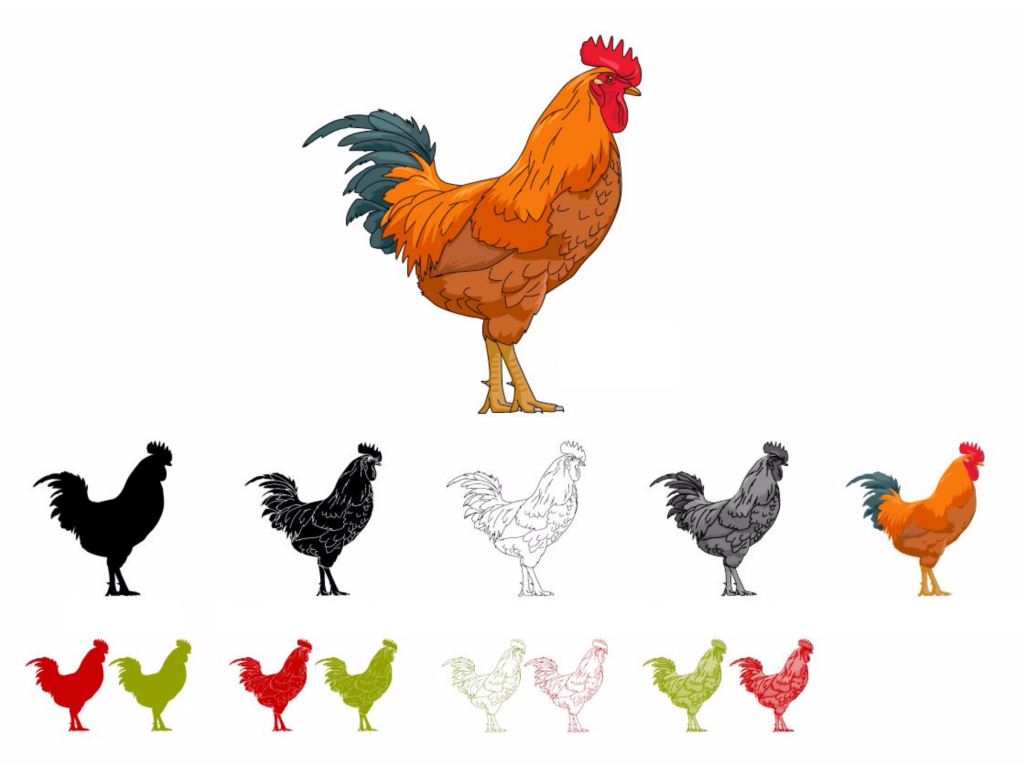
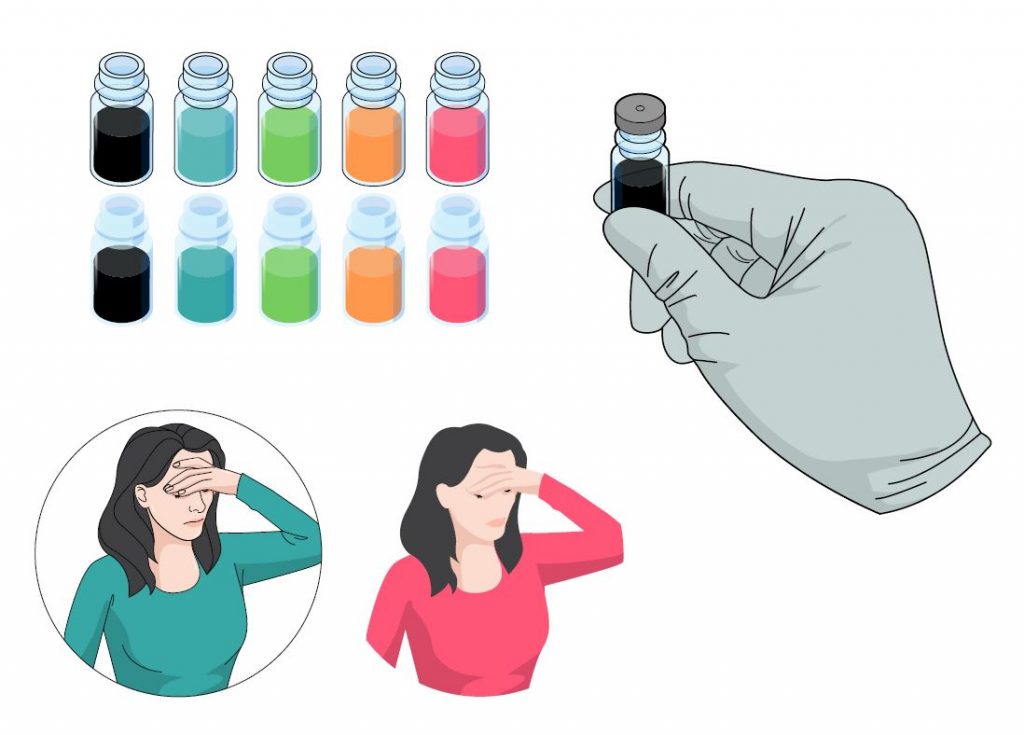
I stedet for å lage en figur ved å kombinere former og bilder som ikke passer sammen, kan du nå finne vitenskapelige illustrasjoner som er tenkt for forskere.
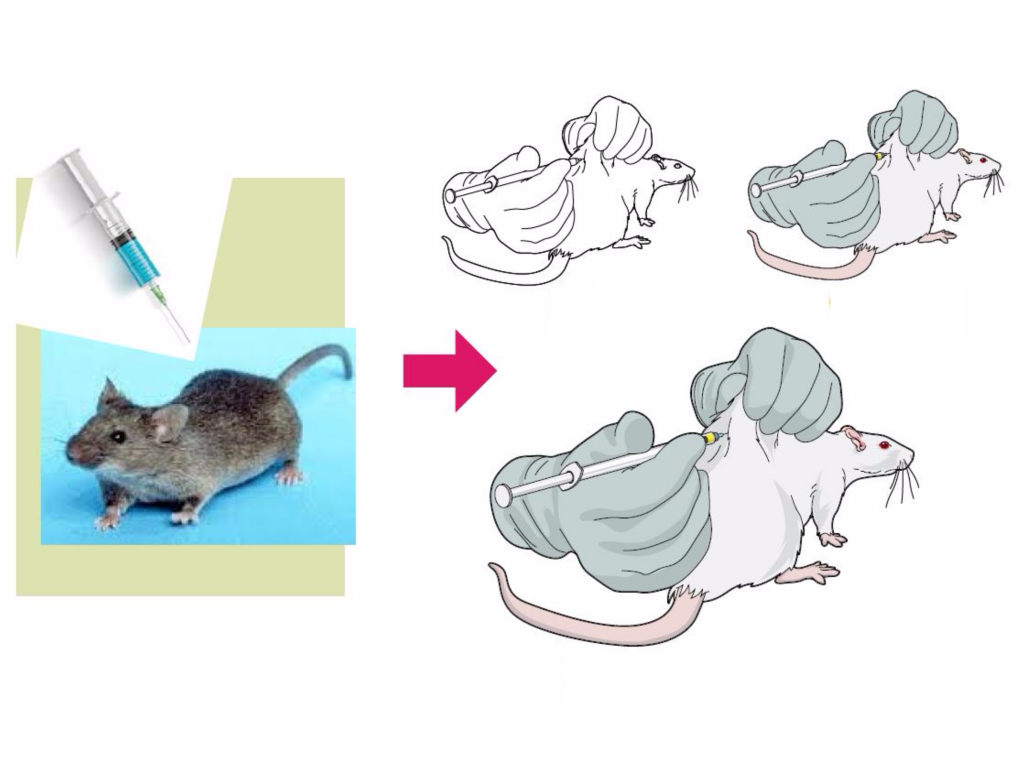 Og vi har et stort utvalg av kategorier. Til sammen mer enn 3000 vitenskapelige illustrasjoner. Ikke bare er brukerne fri til å forme illustrasjonene våre i henhold til deres behov ved å bruke forskjellige versjoner, farger og stiler.
And if you don’t have the time to build an infographic from scratch, you can use any of our templates! All of them are open and can be modified to fit the data you have.
Hvorfor Mind the Graph
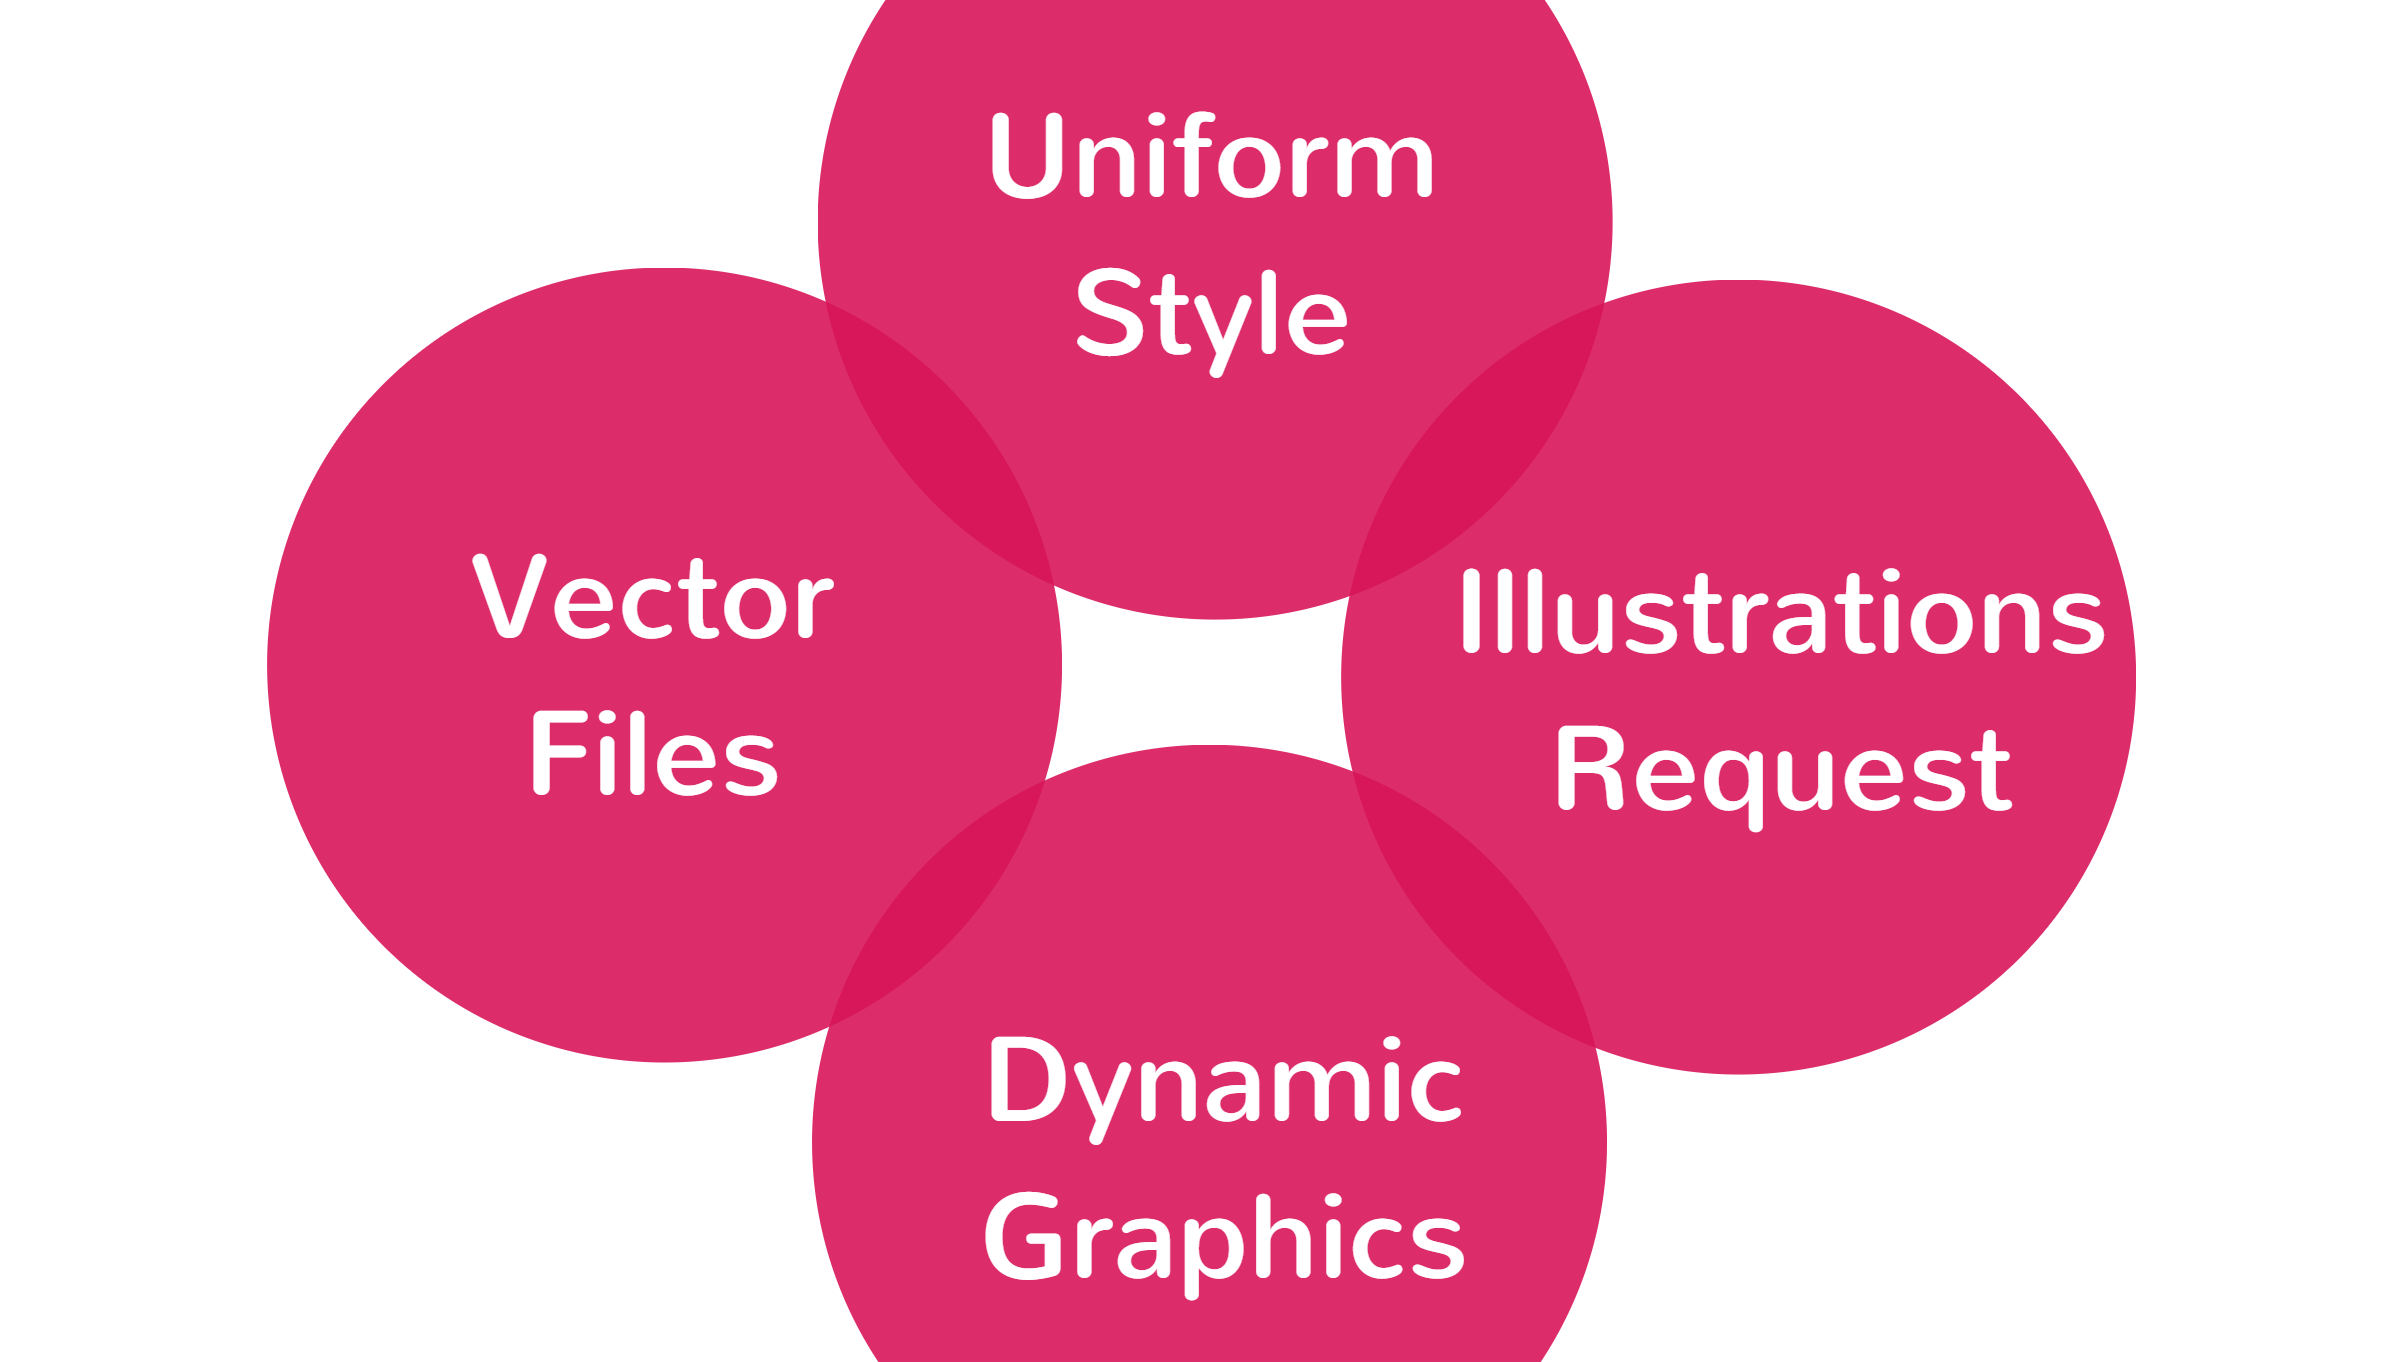
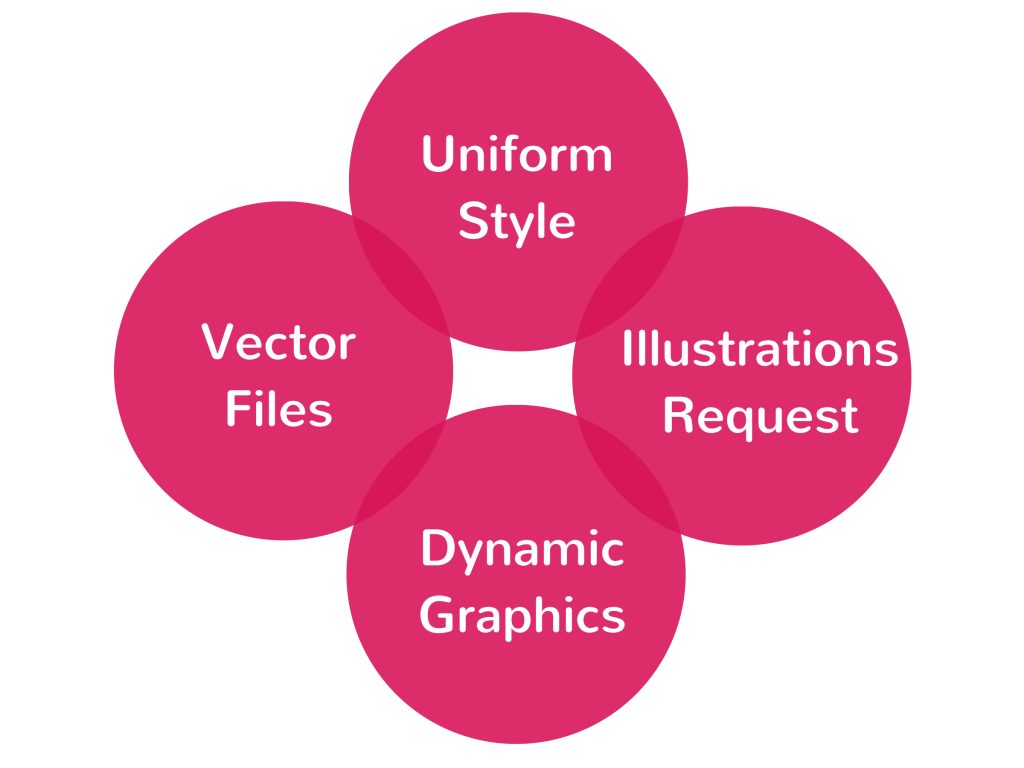
Mind the Graph har fire hovedpunkter som skiller oss fra andre verktøy:
Føler du deg klar til å ta det vitenskapelige arbeidet ditt til et helt nytt nivå?

Abonner på nyhetsbrevet vårt
Eksklusivt innhold av høy kvalitet om effektiv visuell
kommunikasjon innen vitenskap.

