If you are a teacher or if you present your data in scientific congress you probably know how hard it is to keep the audience attention. It can be worse if you are teatching young people. There is a lot of tools you can use to improve your presentations. You need always to choose the best content, improve your speaking skills and create an eye catching presentation. If you want to make awesome presentations, mind the graph can be a powerful ally for you.
Subscribers have an unlimited number of slides to use and they can present directly from the platform. With thousands of scientific illustrations available, it is easier to catch the audience attention.
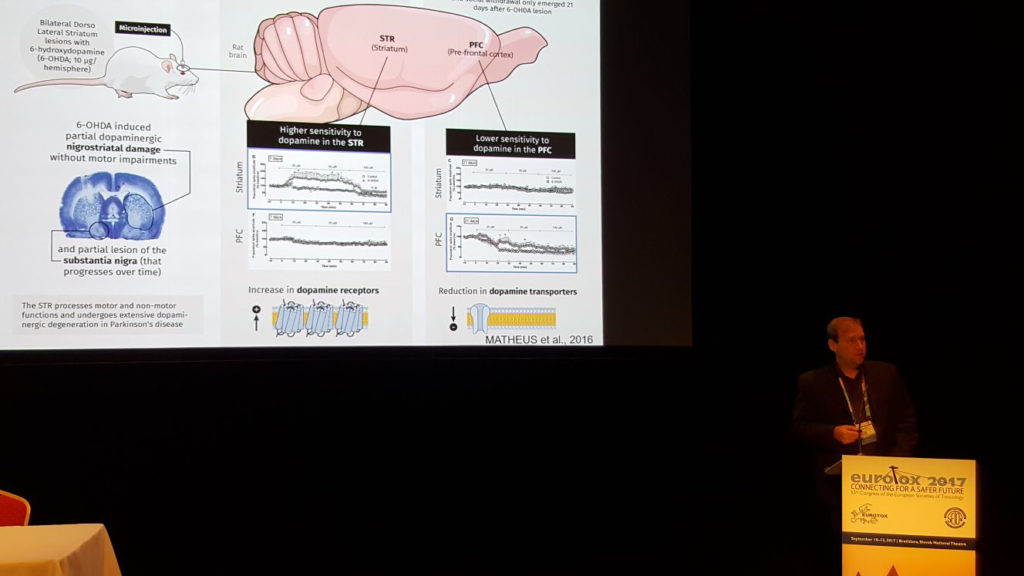
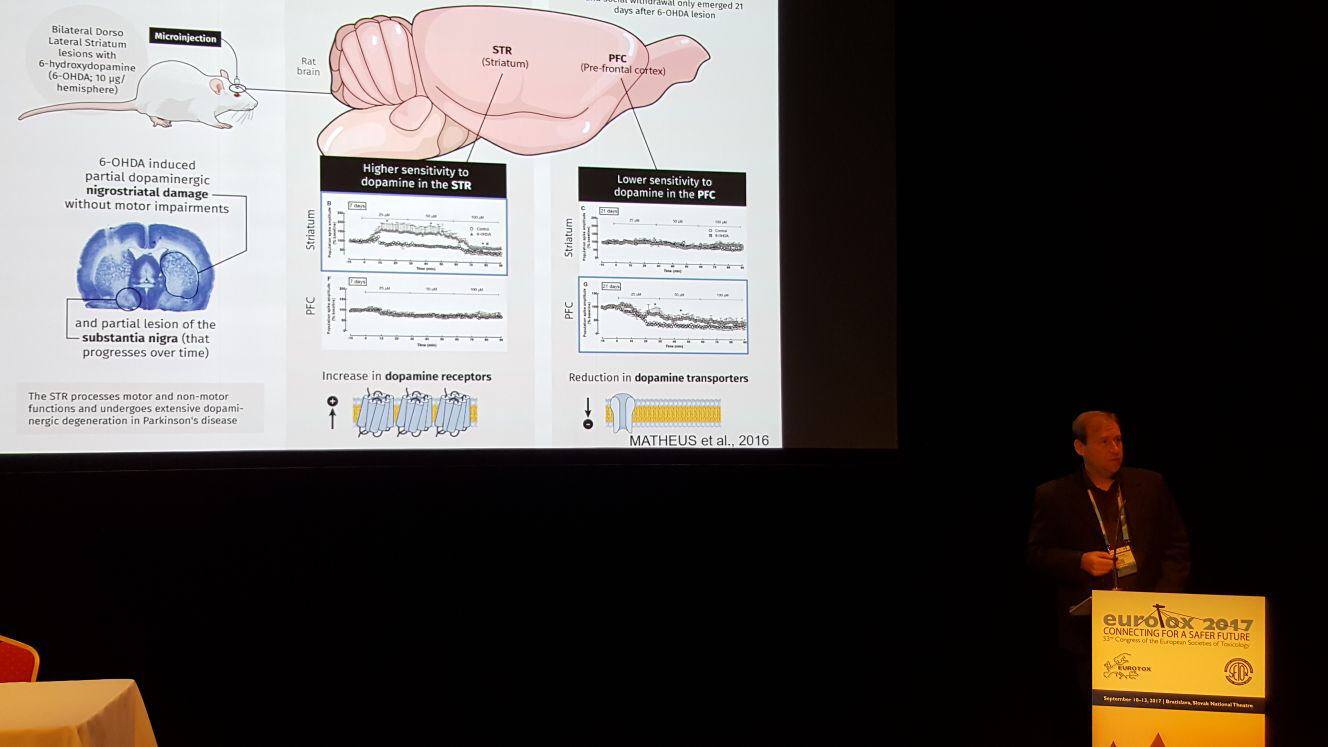
Dessuten bruker mange av grafabonnentene plattformen til å lage presentasjoner og prisutdelinger.vinnende vitenskapelige postere for vitenskapelig kongress.
Hvis du vil lage din egen presentasjon på Mind the Graph, kan du se i veiledningen vår hvor enkelt det er å forbedre kommunikasjonen din:
If you liked the video, try mind the graph and start your own presentations:


Abonner på nyhetsbrevet vårt
Eksklusivt innhold av høy kvalitet om effektiv visuell
kommunikasjon innen vitenskap.