In today’s world of scientific research, the power of visual communication cannot be underestimated. The ability to present complex data in a visually appealing and easily understandable manner is crucial for effectively conveying research findings. This is where Mind the Graph comes in. Mind the Graph is an online platform that is revolutionizing scientific data visualization. Targeting scientists and researchers, the platform provides a user-friendly interface for creating visually captivating scientific figures, infographics, graphical abstracts, presentations, and posters. It caters to individuals, small labs, and large organizations, making it accessible to a wide range of audiences within the scientific community. What sets Mind the Graph apart is its ability to address the challenge researchers face in visualizing complex scientific data without specialized design skills. By offering a range of intuitive tools and educational infographic templates, the platform empowers researchers to easily create visually engaging visuals that enhance scientific communication. In doing so, Mind the Graph is redefining the way scientific research is presented and shared, ultimately propelling scientific advancements forward.
Introduction to Mind the Graph
Purpose and Goals
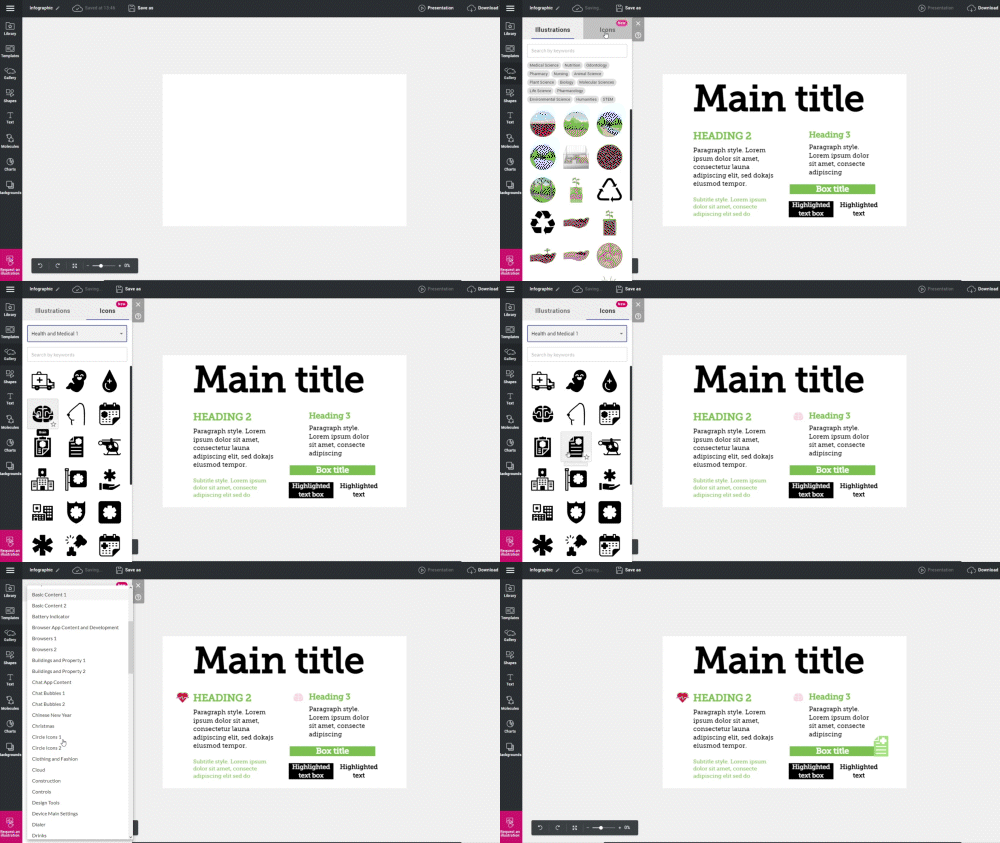
The primary purpose of Mind the Graph is to simplify the process of scientific data visualization. The platform is designed to make complex scientific data more digestible by transforming it into visually appealing and easily understandable graphics. The goal is to aid researchers in disseminating their findings more effectively and engagingly, thus facilitating better comprehension and enhancing the impact of their work.
Mind the Graph is on a mission to democratize scientific data visualization by providing an intuitive interface and versatile tools that do not require any advanced design skills. This accessibility allows researchers to focus on their core work, with the assurance that they can efficiently and accurately depict their data in a visually compelling manner.
Ultimately, the platform aims to advance scientific communication by bridging the gap between complex data and its comprehension. By enabling clear and captivating visualization of scientific data, the tool is contributing significantly to the proliferation of knowledge in the scientific community, fostering collaboration, and accelerating scientific advancements.
Target Audience

The primary target audience of Mind the Graph encompasses a broad spectrum of the scientific community. This includes individual researchers, small research labs, and large scientific organizations. The platform’s utility is not confined to a specific scientific discipline, making it an invaluable tool for scientists across various fields of study, including biology, physics, chemistry, and earth sciences, among others.
In addition to scientists and researchers, the platform also caters to educators in the scientific domain. Professors, lecturers, and teachers can use Mind the Graph to create visually engaging teaching materials that can aid in the effective transmission of scientific concepts to their classrooms and various class of students.
Moreover, Mind the Graph is equally beneficial for science communicators and journalists who need to convey scientific information to a general audience in a visual way that is easy to understand yet accurate. By transforming complex scientific data into visually appealing infographics and figures, they can ensure that the scientific content is accessible and engaging for all.
To sum up the advice in this blog post, anyone who deals with scientific data and requires visually compelling graphics to present their information effectively can benefit from using Mind the Graph.
User Friendliness
A standout feature of Mind the Graph is its dedicated focus on user-friendliness. Recognizing that not all scientists and researchers have advanced design skills, the platform is designed to be easily navigable and intuitive. This ensures that users can create visually compelling scientific figures, infographics, and presentations without having to grapple with a steep learning curve.
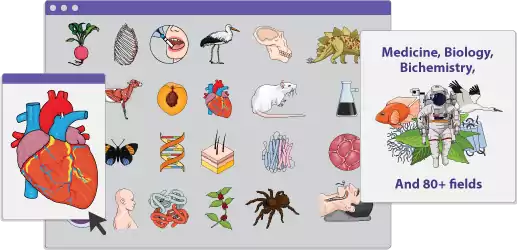
The platform provides a wide array of pre-designed infographic templates that cater to various needs and research fields. Users can effortlessly select a full infographic template that suits their requirements and then customize it with their data. This simplicity is complemented by a robust set of tools that allows users to modify and adapt graphics to their specific needs, all within a straightforward and user-friendly interface.
Moreover, novices in data visualization are not left stranded. Mind the Graph also offers a wealth of free educational resources, including tutorials, tips and guides, to help users get up to speed with the platform and the principles of effective data visualization. This commitment to user-friendliness ensures that Mind the Graph can be a potent tool for any scientist or researcher looking to enhance their scientific communication with impactful visuals.
Revolutionizing Data Visualization in Scientific Research
Making Scientific Communication More Engaging

In the realm of scientific research, communication is key. The ability to effectively convey research findings not only enhances understanding but also drives the scientific discourse forward. Mind the Graph is playing a crucial role in this aspect, by transforming scientific communication into a more engaging experience.
Visuals carry an inherent advantage in communication: they are processed much faster by the human brain than text. By leveraging this, Mind the Graph enables researchers to present their complex data in visually appealing formats, using examples such as infographics, graphical abstracts, and figures. This visual approach not only enhances the understanding of the data but also captures and holds the audience’s attention, thus making the communication more engaging.
Moreover, the platform’s easy-to-use interface and customizable templates give researchers the freedom to express and explore their creativity in their presentations. This adds a unique touch to their work, making it more appealing to the audience and setting it apart from conventional scientific presentations.
In essence, Mind the Graph is redefining scientific communication by making it more visually engaging, thereby enhancing the impact and reach of scientific research.
Overcoming Data Visualization Challenges
Data visualization in scientific research often poses numerous challenges, especially when dealing with complex data sets. Researchers may struggle with deciding how best to represent their data, ensuring accuracy in representation, and making the visuals appealing and understandable. Mind the Graph addresses these challenges head-on, providing a quick look at practical solutions for researchers.
The platform offers a variety of pre-designed templates that can cater to different types of data and research fields. These templates serve as a starting point, taking away the initial hurdle of deciding how to represent the data. From there, the intuitive tools and features allow researchers to customize multiple versions of the templates to fit their specific data and research findings accurately.
Furthermore, Mind the Graph understands the importance of making scientific data accessible and understandable to a broad audience. To this end, the platform’s interface and tools are designed to help researchers create visually appealing and easily comprehensible graphics. This includes features like color selection, font options, and shape customization that can significantly enhance the visual appeal and clarity of the data representation.
In essence, Mind the Graph acts as a valuable ally for researchers, helping them overcome the common challenges associated with scientific data visualization.
Integrating Mind the Graph in Scientific Research
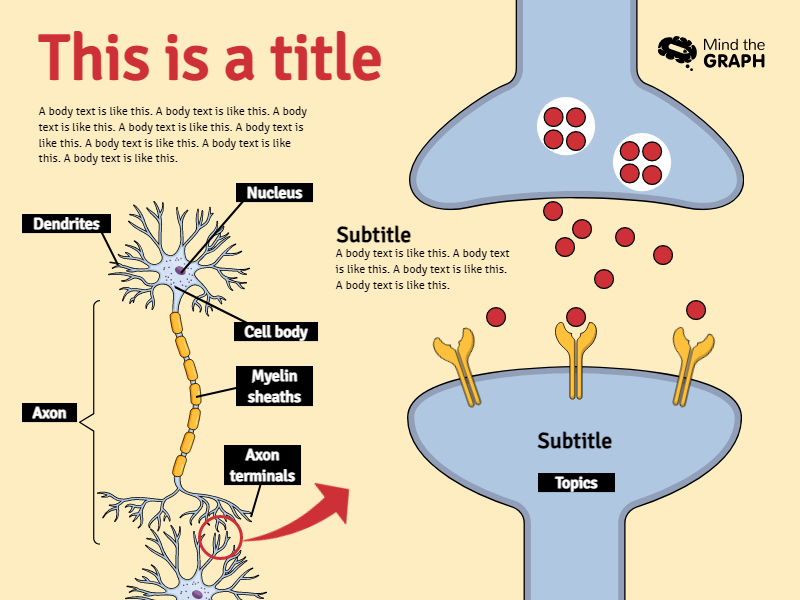
The integration of Mind the Graph into the scientific research process is straightforward and beneficial. Given the platform’s user-friendly interface and an array of tools and templates, researchers can easily incorporate it into their workflow to create compelling visual representations of their data.
The process begins with the selection of a template that aligns with the researcher’s specific needs. Once a template is selected, researchers can input their data, modify graphics, and customize the visual elements to accurately represent and explain their findings. The platform’s set of tools allows for fine-tuning of details, ensuring the created visuals reflect the data accurately and convey information most effectively.
Beyond the visualization of research data, Mind the Graph can also be utilized for creating engaging presentations and posters for conferences and meetings. By leveraging the platform’s capabilities, researchers can ensure their work stands out and is well-received by their peers, thereby enhancing their scientific communication and impact.
In summary, integrating Mind the Graph into the research process can significantly enhance the visualization and presentation of scientific data, thereby aiding in the effective communication and dissemination of research findings.
Benefits of Visual Communication in Scientific Research
Enhancing Accessibility and Engagement

Visual communication in scientific research plays a significant role in enhancing accessibility and engagement. By transforming complex data into visually appealing and easily understandable graphics, researchers can effectively communicate their findings to a much broader audience.
Mind the Graph facilitates this process, providing an array of tools and infographic templates that allow for the creation of engaging visual representations of scientific data. This not only makes the data more digestible but also makes scientific findings more approachable for individuals without a scientific background. This accessibility is crucial in today’s interconnected world, where scientific findings often have widespread implications beyond the scientific community.
Moreover, visually engaging graphics can significantly increase the engagement of the audience. By capturing the audience’s attention and facilitating understanding of complex concepts, visuals can stimulate discussion, encourage sharing of the findings, and even inspire further research. In this way, visual communication, facilitated by platforms like Mind the Graph, can significantly enhance the impact and reach of scientific research.
Ultimately, the use of visual communication in scientific research, particularly through user-friendly platforms like Mind the Graph, can greatly contribute to the accessibility and engagement of research findings.
Advantages Of the Scientific Community

The use of visual communication in scientific research, particularly through platforms like Mind the Graph, brings multiple advantages for the scientific community. Foremost among these is the enhancement of scientific communication. By transforming complex data into visually appealing graphics, researchers can effectively communicate their findings to their peers, fostering better understanding, and stimulating scientific discourse.
Moreover, the accessibility provided by visual communication opens up the scientific community to a broader audience. This can lead to increased public interest and understanding of scientific research, fostering a culture of scientific literacy, education and appreciation.
Visual communication also facilitates interdisciplinary collaboration. By presenting data in a visually understandable format, researchers can effectively communicate their findings to colleagues from different scientific disciplines. This can lead to collaborations that bridge disciplines, fostering innovation and advancement in scientific research.
Lastly, the use of platforms like Mind the Graph can enhance efficiency within the scientific community. By providing an efficient and easy-to-use platform for data visualization, researchers can save time and resources that can be better utilized for their core research activities.
In essence, the use of visual communication in scientific research, particularly through platforms like Mind the Graph, has the potential to significantly enhance the effectiveness, reach, and efficiency of the scientific community.
Success stories and testimonials
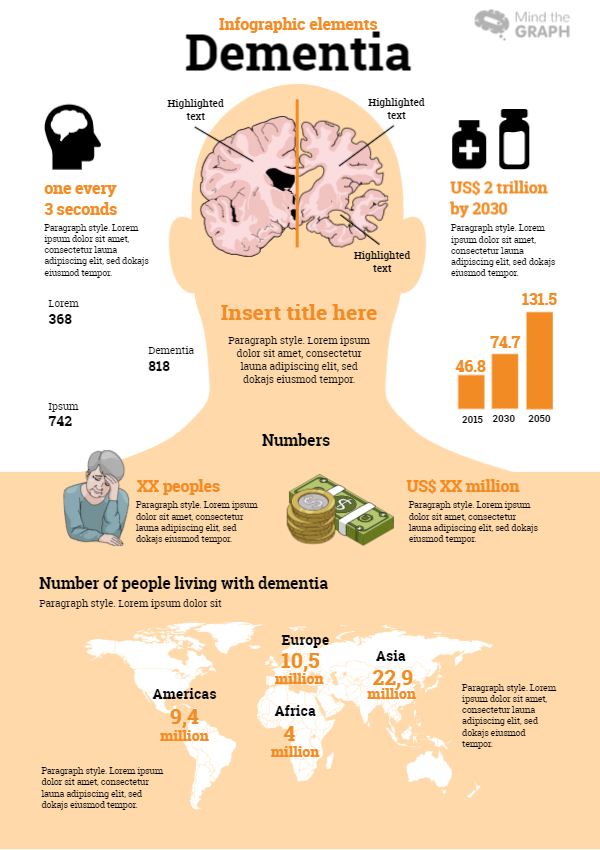
The impact of visual communication in scientific research, facilitated by platforms like Mind The Graph, is best illustrated through success stories and testimonials from the scientific community.
Many researchers have lauded the platform for its user-friendliness and effectiveness in communicating complex data. For instance, a researcher in the field of genomics expressed how the platform enabled them to visually represent intricate genomic sequences in an understandable and visually appealing manner. This not only enhanced the researcher’s presentation but also stimulated engaging discussions and ideas among peers.
Educators in the scientific domain have also praised Mind the Graph. A biology teacher and professor used the platform to create engaging classroom teaching materials, noting that the visually appealing and understandable graphics significantly enhanced students’ engagement and comprehension of complex biological concepts.
Similarly, a science communicator recounted how the platform allowed them to effectively convey complex scientific findings to a general audience. The use of visually captivating educational infographics facilitated understanding and stimulated interest among readers, enhancing the impact of their professional science communication efforts.
These success stories and testimonials underscore the significant benefits of visual communication in scientific research, particularly when facilitated by user-friendly, fun and effective platforms like Mind the Graph. Sign up for free and try it now!

Subscribe to our newsletter
Exclusive high quality content about effective visual
communication in science.

