As we mentioned on the very first post of this series about coronavirus, the rythm of scientific publications on this field is skyrocketing.
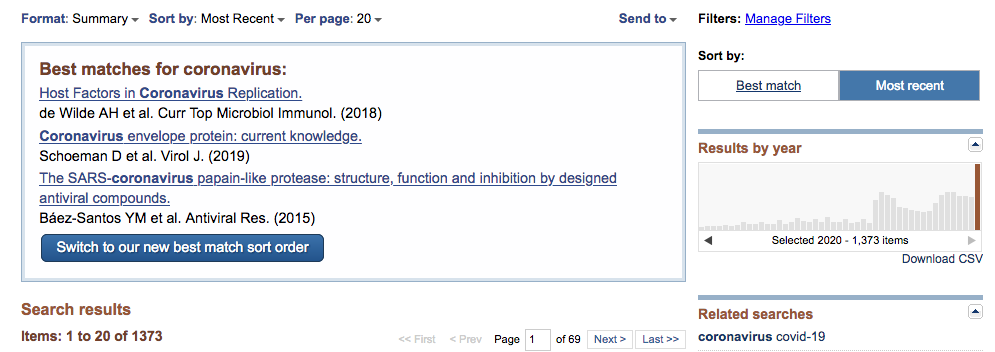
The word “coronavirus” is a popular search term in the scientific literature, according to specialized search engines like PubMed of the United States National Library of Medicine.
The image below is from a study from The Economist, but checked the source and its already outdated. As of today (March 24) we counted exactly 1373 mentions to the word “coronavirus” in the PubMed system. It’s quite a lot information.
The term became “sexy’ in the scientific literatura due to the Severe Acute Respiratoy Syndrome (SARS) outbreak in the early 2000’s. On average, we had about 500 papers per year published about coronaviruses, an average of ~1.3 papers/day. This research trend kind of passed and the interest of the scientific community was “rescued” by the Middle East Respiratory Syndrome (MERS) in the year 2012 (avg. 2.2 paper/day). The average number of papers published about “coronavirus” surpassed 800 per year in this decade.
This year, with the recent coronavirus Covid-19 outbreak, the interest of the scientific community raised again, and the number of publications is skyrocketing. I counted 1373 results for a search done today in PubMed. If that’s accurate, we are speaking about something like 16 paper published per day in the year 2020.
1373 papers about coronavirus just this year. That’s quite a lot, who can read all this information?

No president can go to the public without someone who actually knows what’s he’s saying to look over his shoulders during this pandemy.
The picture is blurred, but on the left side you see Dr. Deborah Brix, a highly respected medical expert with over 3 decades experience specializing in HIV/AIDS. She was named United States global AIDS coordinator in charge of PEPFAR under President Barack Obama administration and continues to be a leading figure in the infectology / virology field. Surely an important voice during this tough period.
The president may or may not hear or take the voice into consideration, that’s true… but he must show up like someone who at least get advices with the experts.
How do these people digest so much information and stay updated? We believe in the power of infographics to communicate complex scientific information.
Discover what is Mind the Graph – the infographic maker for scientists and academics

Subscribe to our newsletter
Exclusive high quality content about effective visual
communication in science.


