2 min läsning
08/29/2018
Den vetenskapliga bloggen Mind The Graph är tänkt att hjälpa forskare att lära sig hur man kommunicerar vetenskap på ett okomplicerat sätt.
Att publicera en uppsats som ingen någonsin kommer att läsa är inte roligt. Istället är det fantastiskt att få reda på att någon över hela världen läser och citerar ditt arbete. Men hur vet man vad som har hänt med ens forskning? Hur kan man vara medveten om vilken effekt man genererar med sina publikationer? [...]
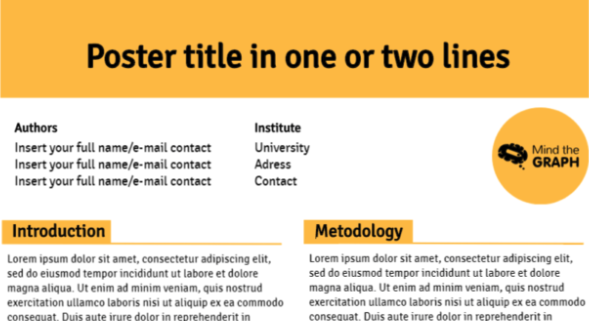
Att presentera en vetenskaplig poster är ett vanligt sätt att kommunicera vetenskaplig forskning. Det är en [...].
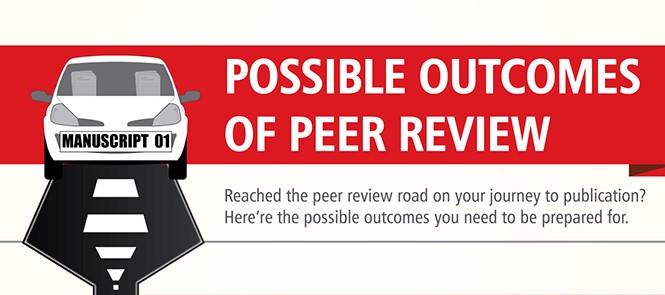
När allt arbete är gjort och granskat ett par hundra gånger kommer den så efterlängtade [...]
Om du tror att publicering av en artikel är det enda sättet att få synlighet för din [...].
När det handlar om information är det ingen trend att kombinera siffror och text. Att kalla det infografik [...]
Referens inom datavisualisering, Alberto Cairo är ett av de största namnen när det gäller [...]
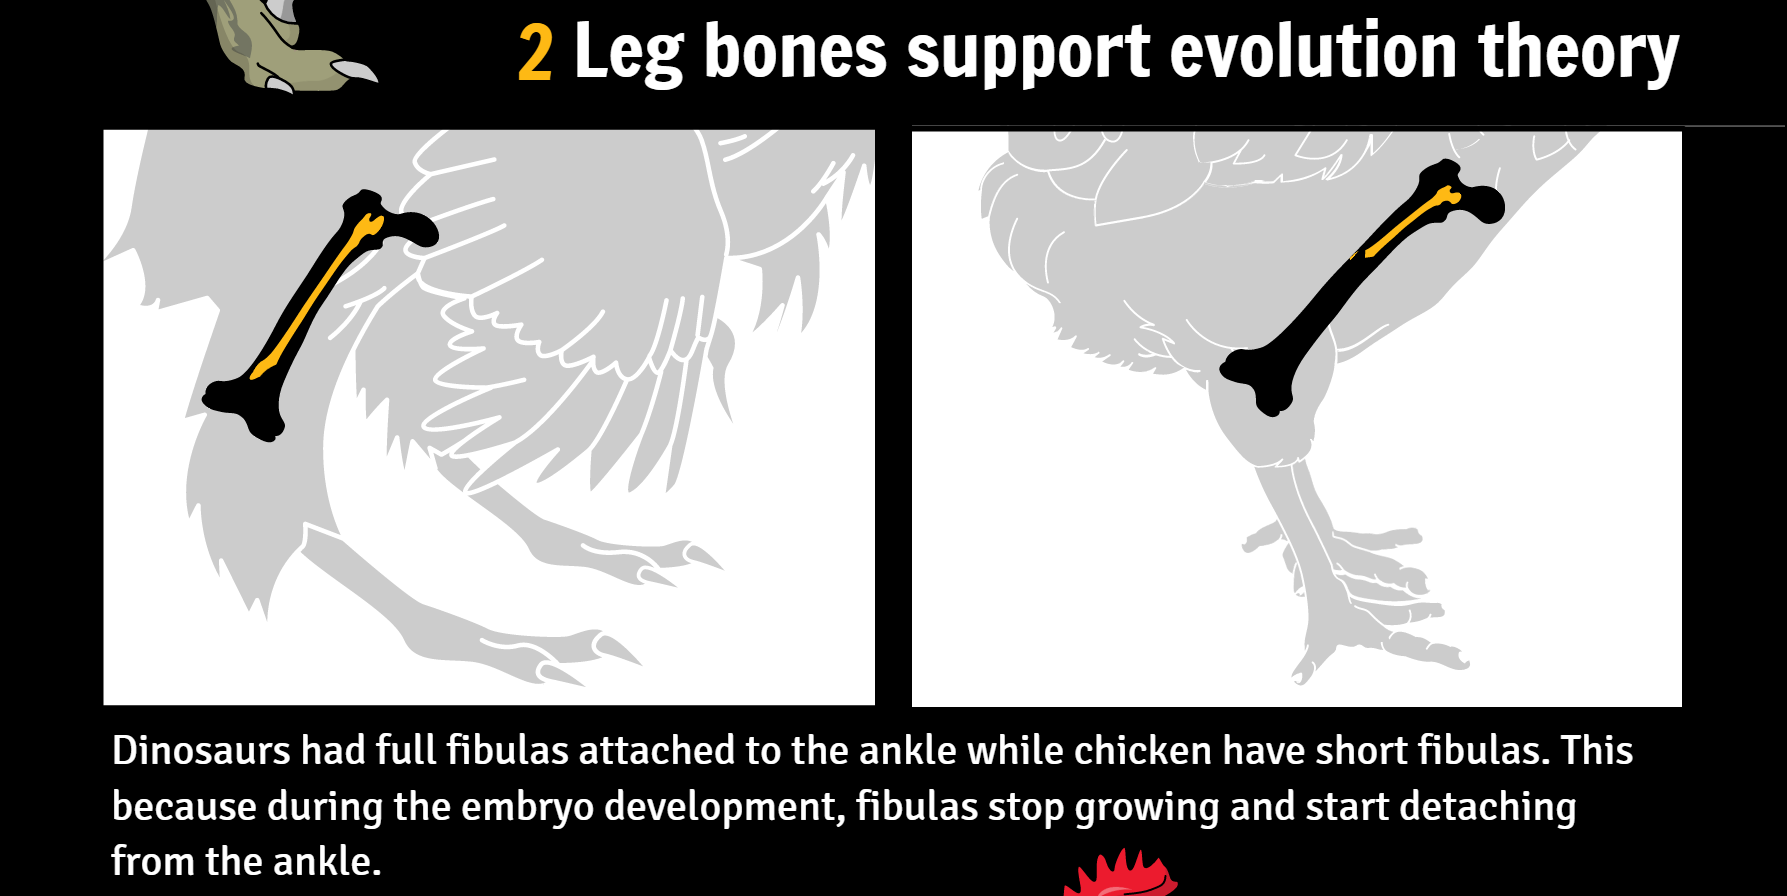
Förra veckan publicerade Botelho et al. en ny forskningsrapport om genmanipulation hos kyckling. Deras [...]
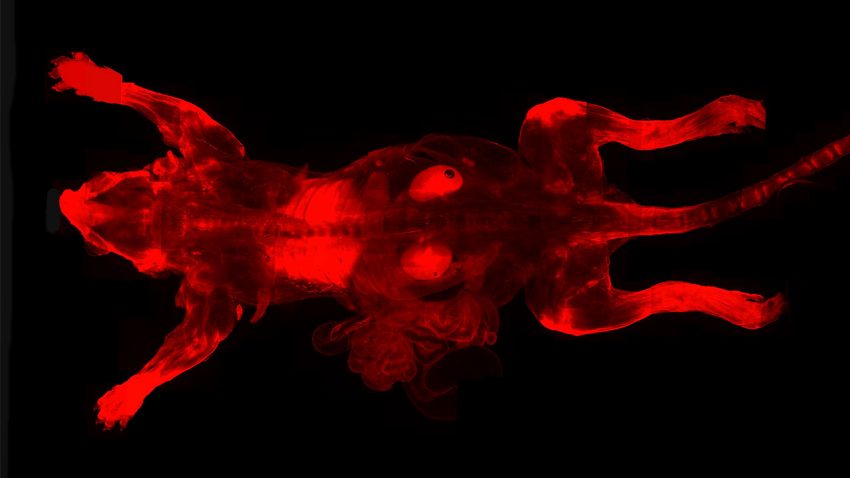
Science fiction-filmer har gett oss hopp om att utveckla superkrafter som osynlighet, superstyrka [...].
Paris, Frankrike & San Diego, Kalifornien (27 oktober 2016) - AgileBio, en ledande global leverantör av [...]
Isaac Newton 45 år - Publicerade Philosophiae Naturalis Principia Mathematica (Matematiska principer för [...]
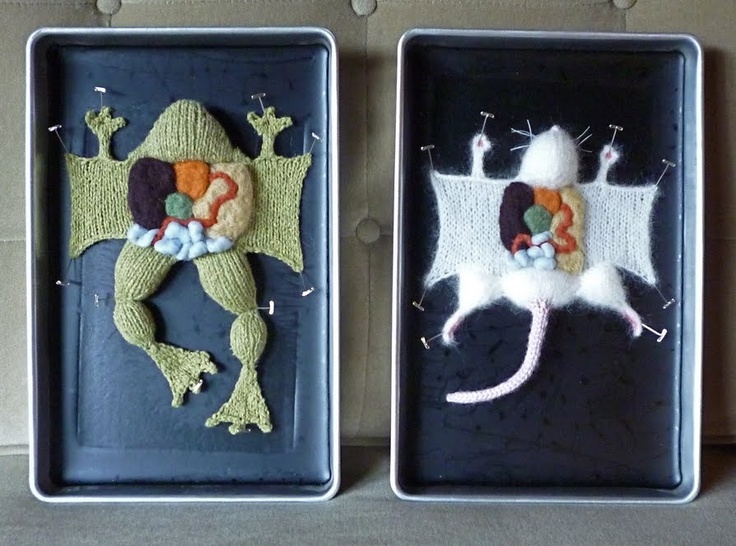
Det är alltid lika roligt när vi får se våra användares fantastiska arbete. Jag har redan skrivit om [...]
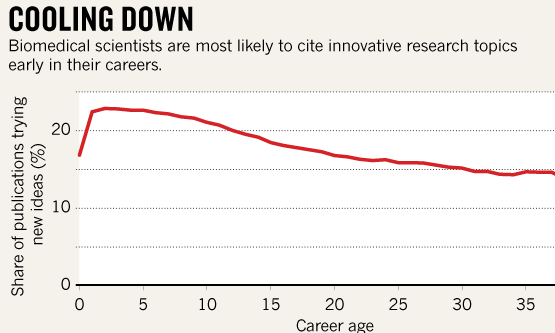
Att vara forskare är ingen lätt uppgift. Självständigheten att ha sitt eget arbete kommer [...].
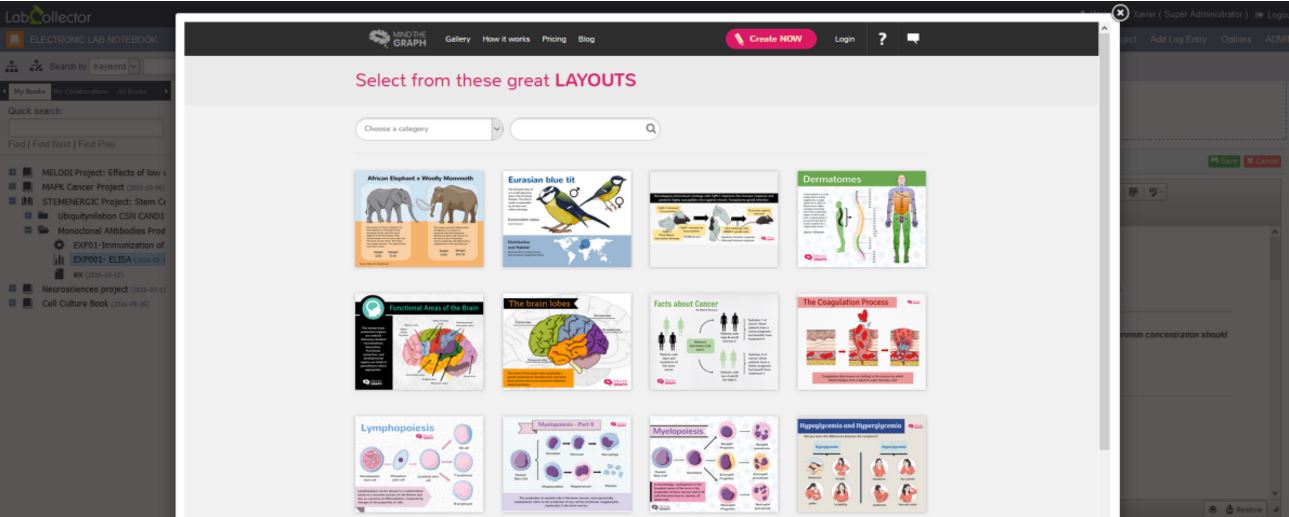
Det första intrycket Mind the Graph-användare får när de loggar in på vår plattform är: [...]