2 min läsning
12/06/2019
Den vetenskapliga bloggen Mind The Graph är tänkt att hjälpa forskare att lära sig hur man kommunicerar vetenskap på ett okomplicerat sätt.
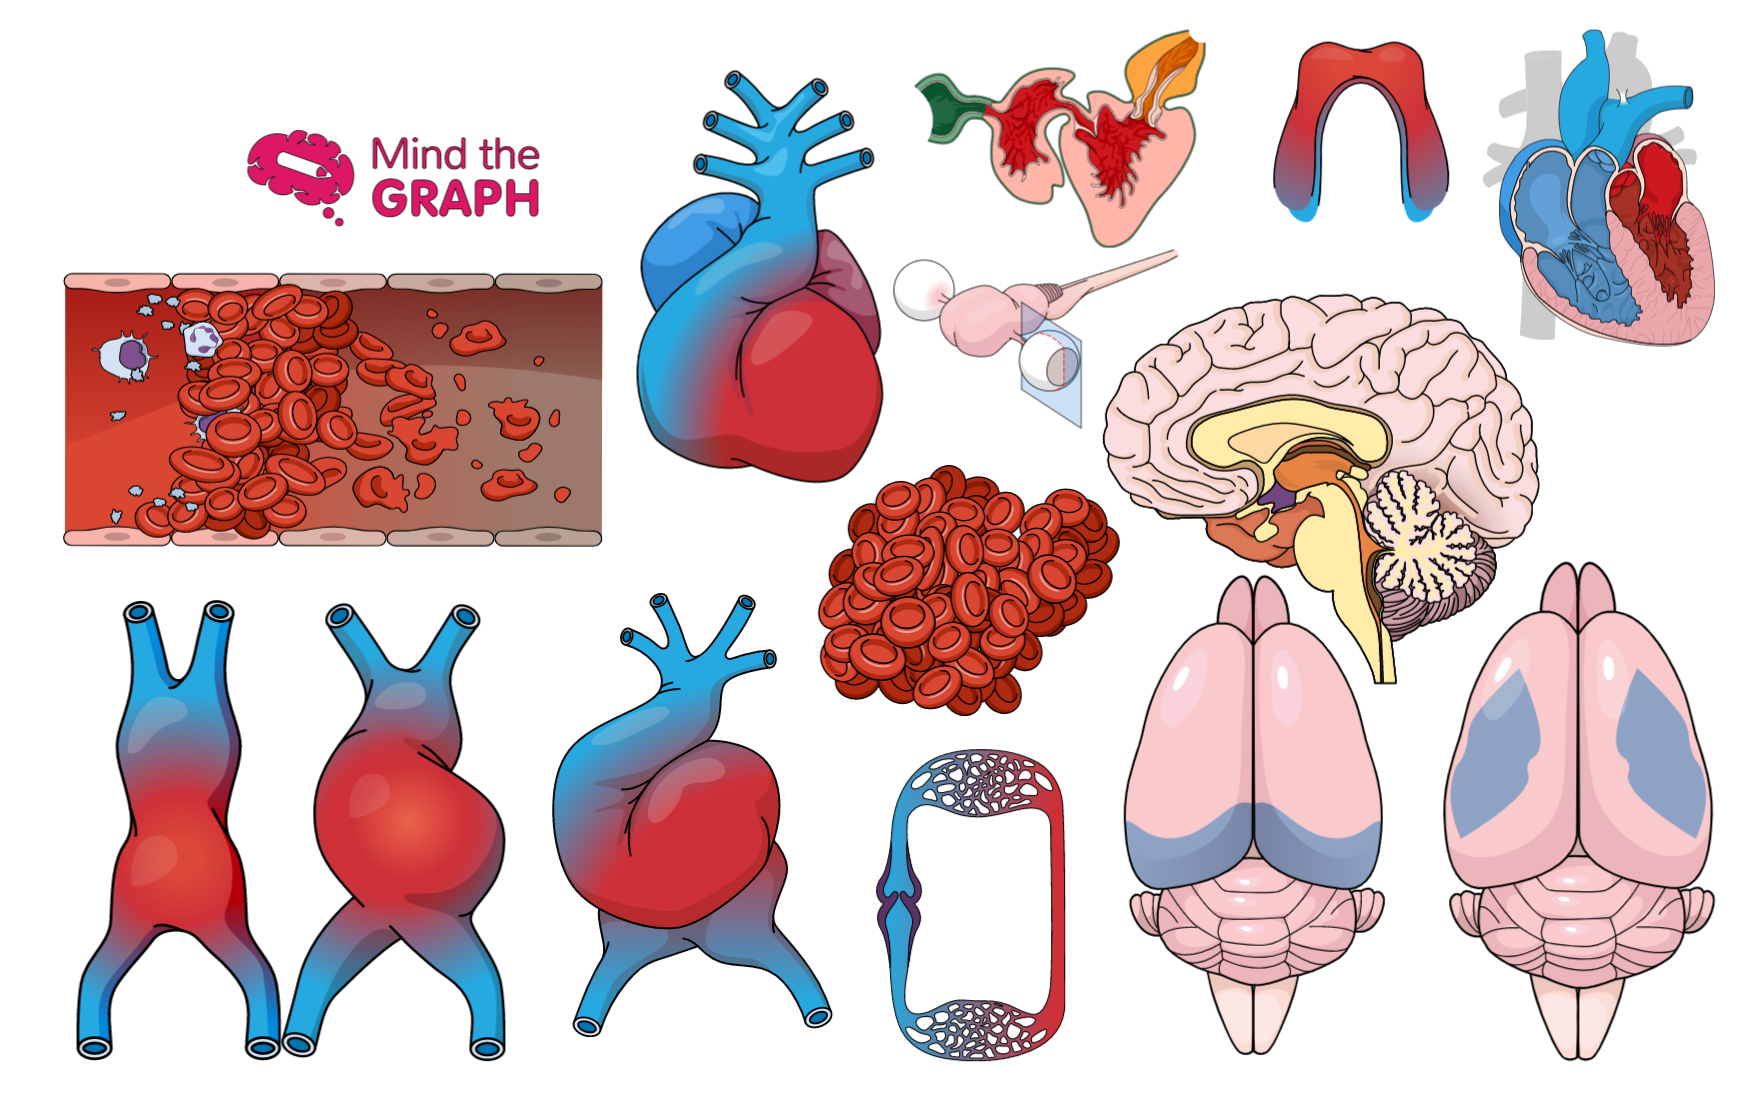
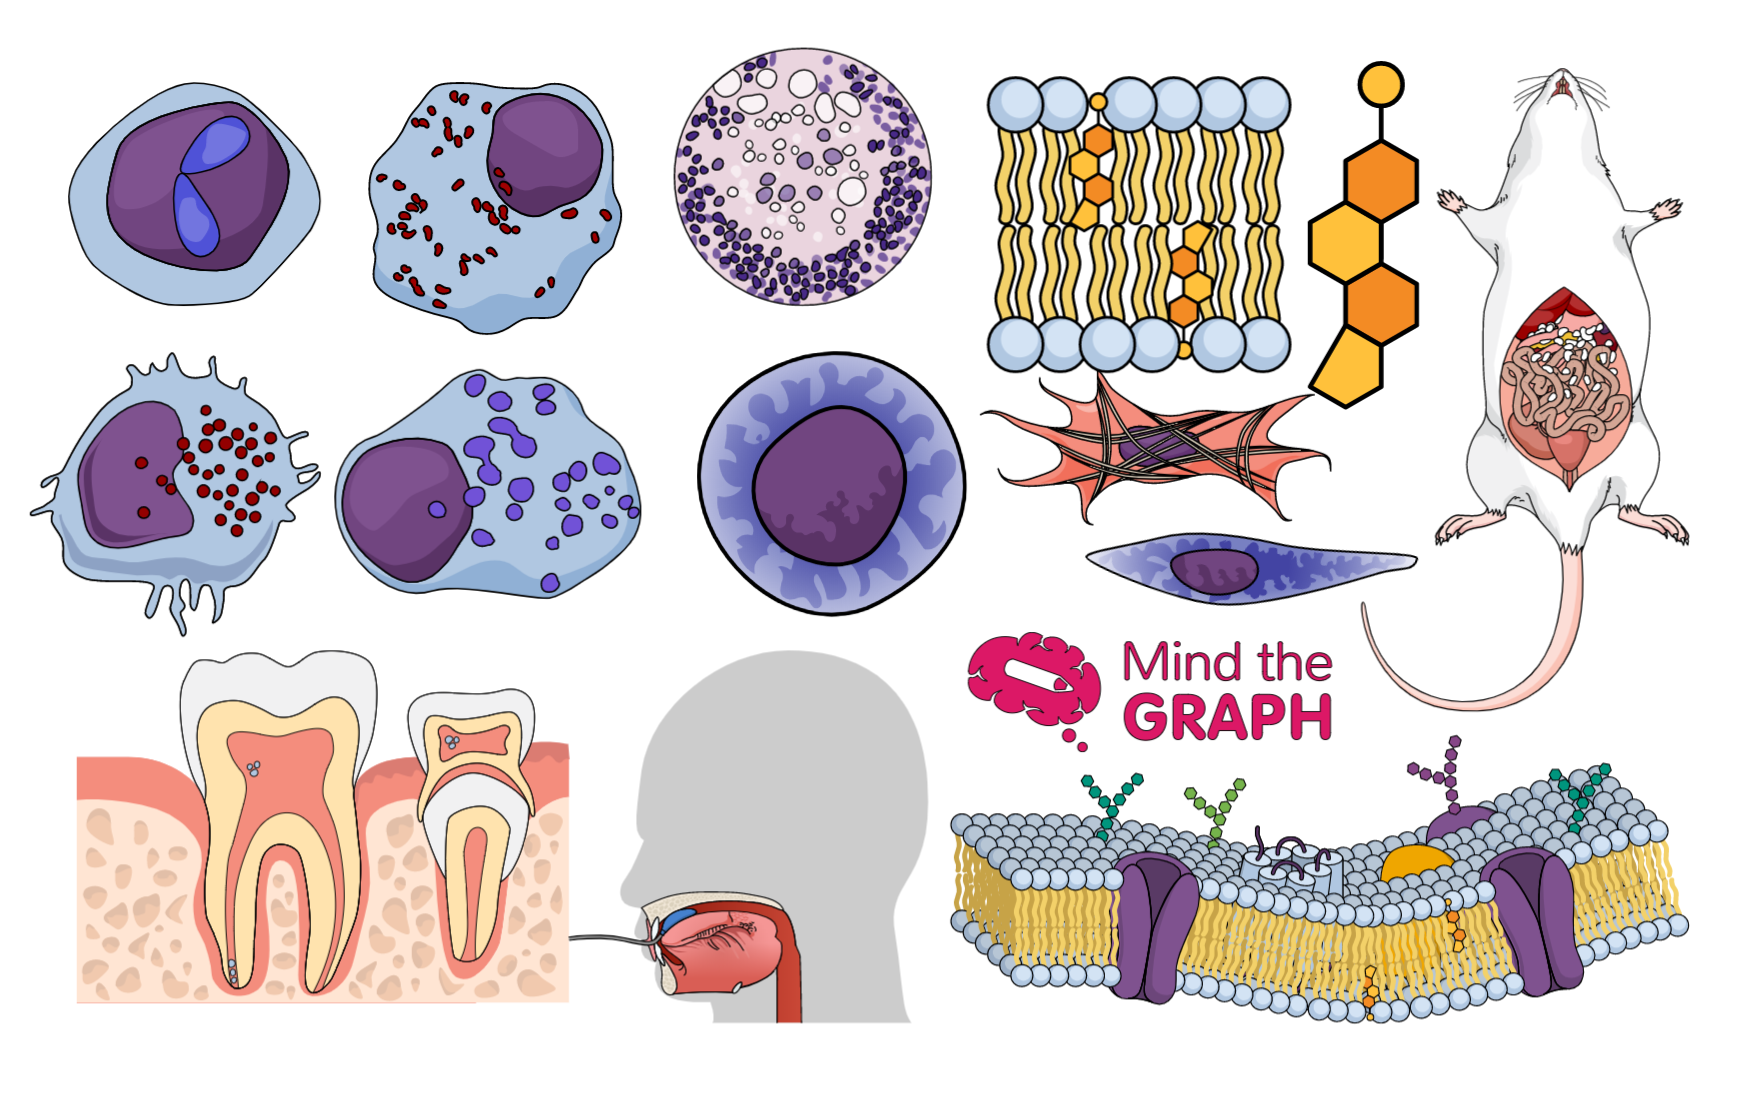
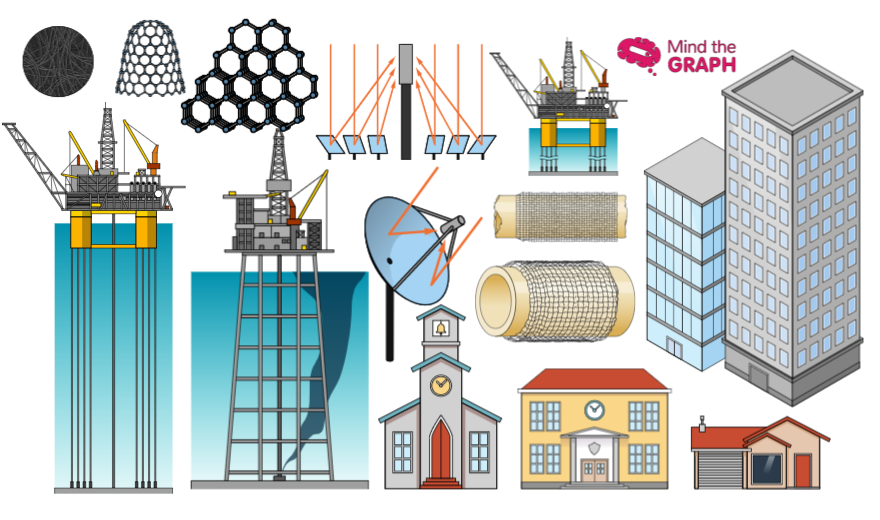
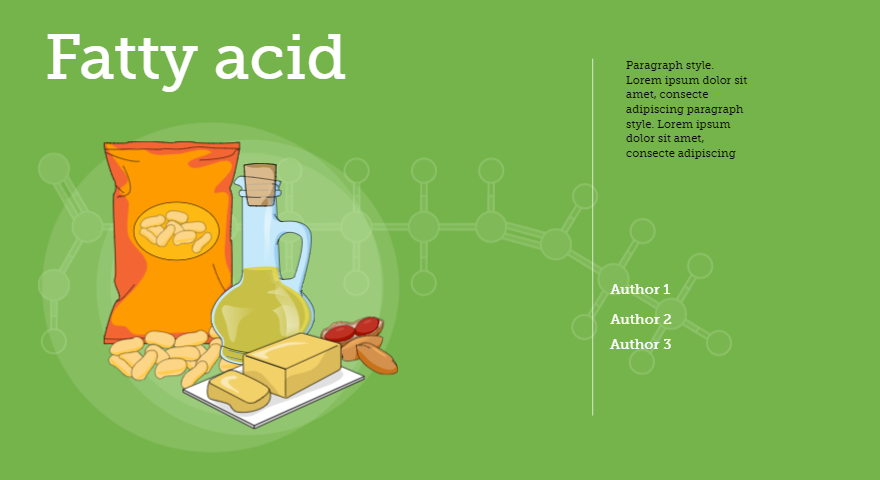
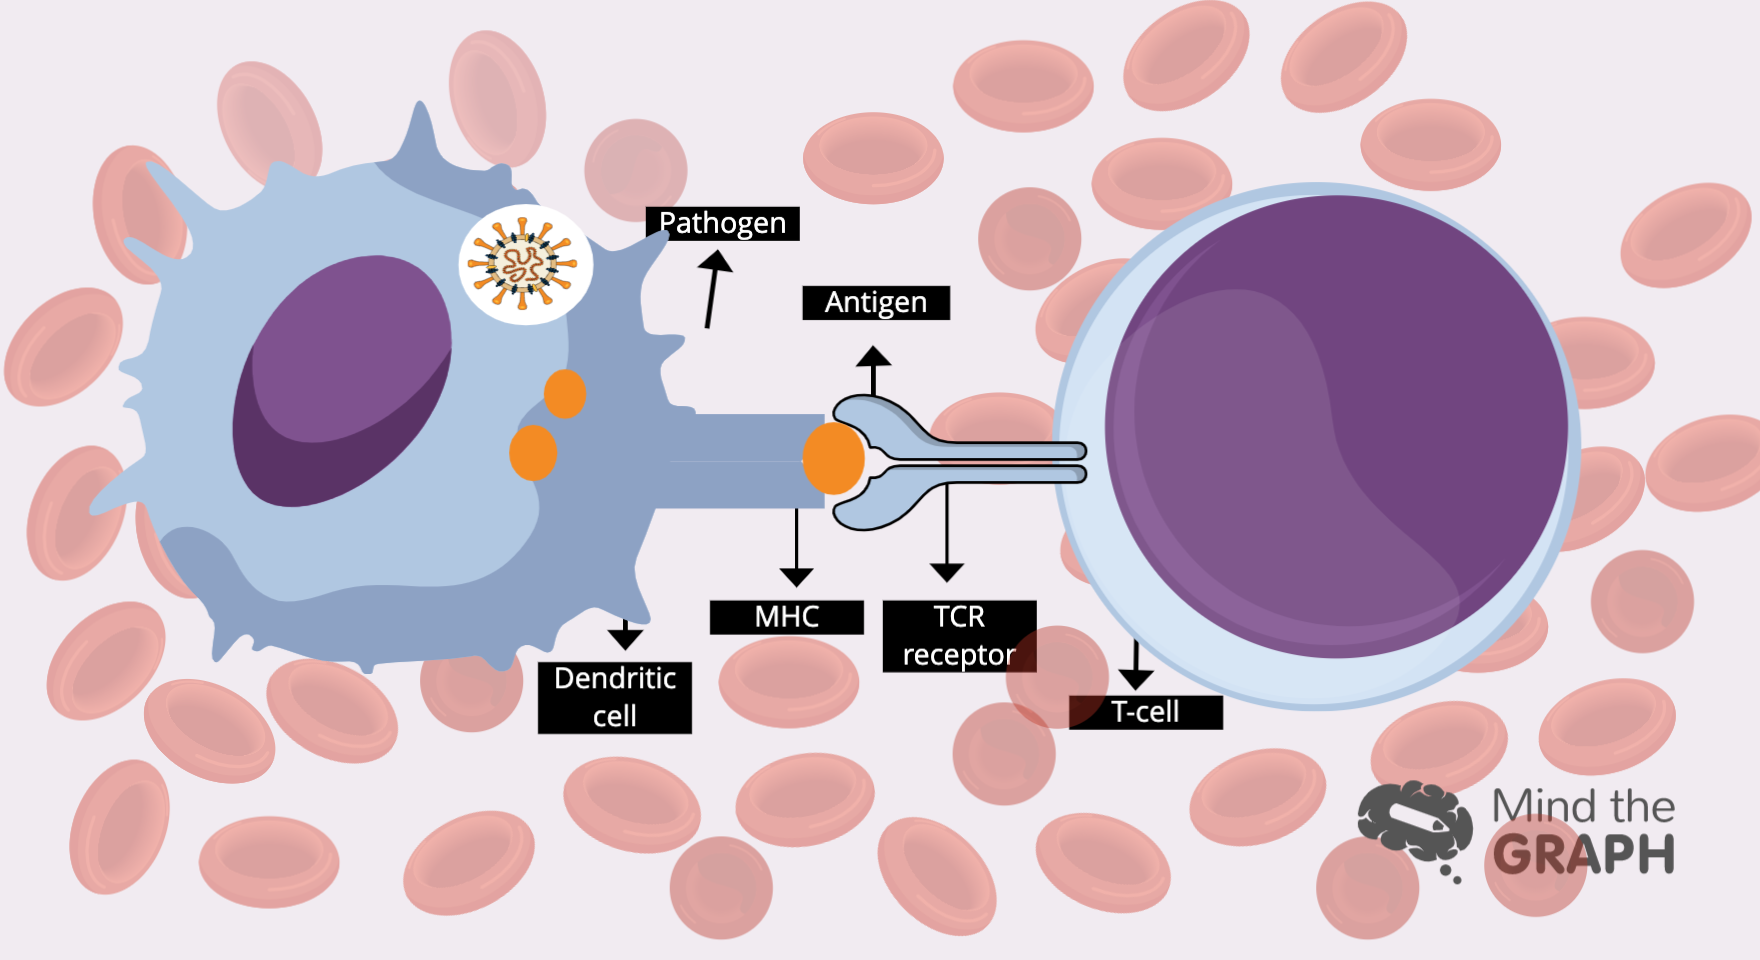
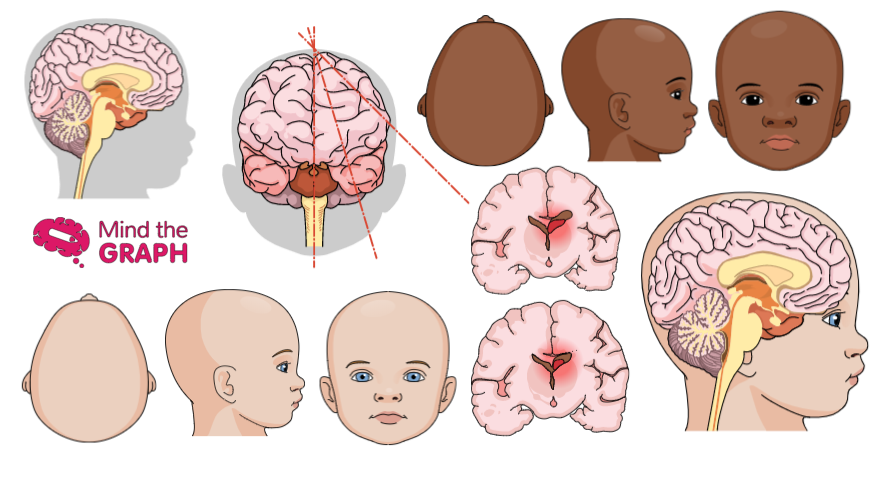
Hej på er! Som ni kanske vet är fredag dagen då vi delar med oss av de nya vetenskapliga illustrationerna. Den här veckan har vi lagt till flera exklusiva illustrationer som är tillgängliga för alla mind the graph-användare (inklusive gratisanvändare). Figurerna nedan är ett litet urval av vårt kompletta bibliotek. Vi har skapat den största onlinedatabasen med vetenskapliga illustrationer. Så kolla [...]
Under dagarna 24 och 25 december 2019 hölls ett möte med Sindicato das Empresas [...].
Idag har vi en gästförfattare - Maryam Kamal - som är en font duos designer [...].
Olá! Espero que esteja aproveitando sua sexta-feira! Estou escrevendo para trazer boas notícias: temos muitas [...]
Hej igen! Som du kanske vet lägger vi varje vecka till nya illustrationer i vårt bibliotek. [...]
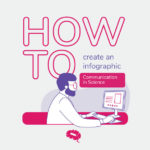
Upptäck hur du skapar ett effektivt grafiskt abstract. Den här guiden hjälper dig att skapa en övertygande visuell sammanfattning för att öka forskningens genomslagskraft.
Hallå där! Är ni förväntansfulla inför helgen? Det är vi också! Dessutom är fredag den [...]
Hej, idag kommer jag med goda nyheter! Som du kanske vet tillhandahåller vi infografik och [...]
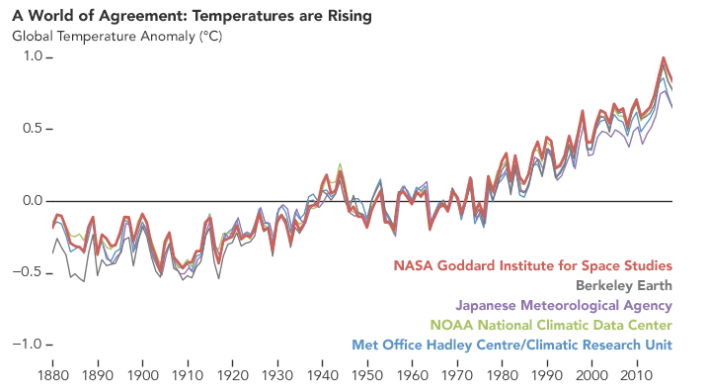
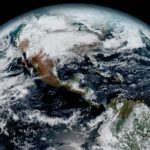
Klimatförändringarna är fortfarande ett kontroversiellt ämne. Ibland försvinner de vetenskapliga bevisen till förmån för personliga åsikter och [...].
Olá! Det är sexta-feira i november. Innan vi börjar prata om förväntningarna inför semestern, [...]
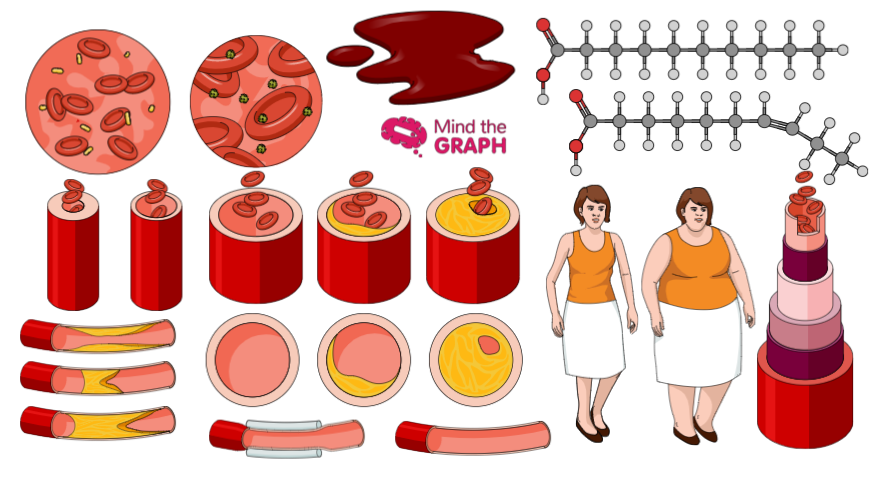
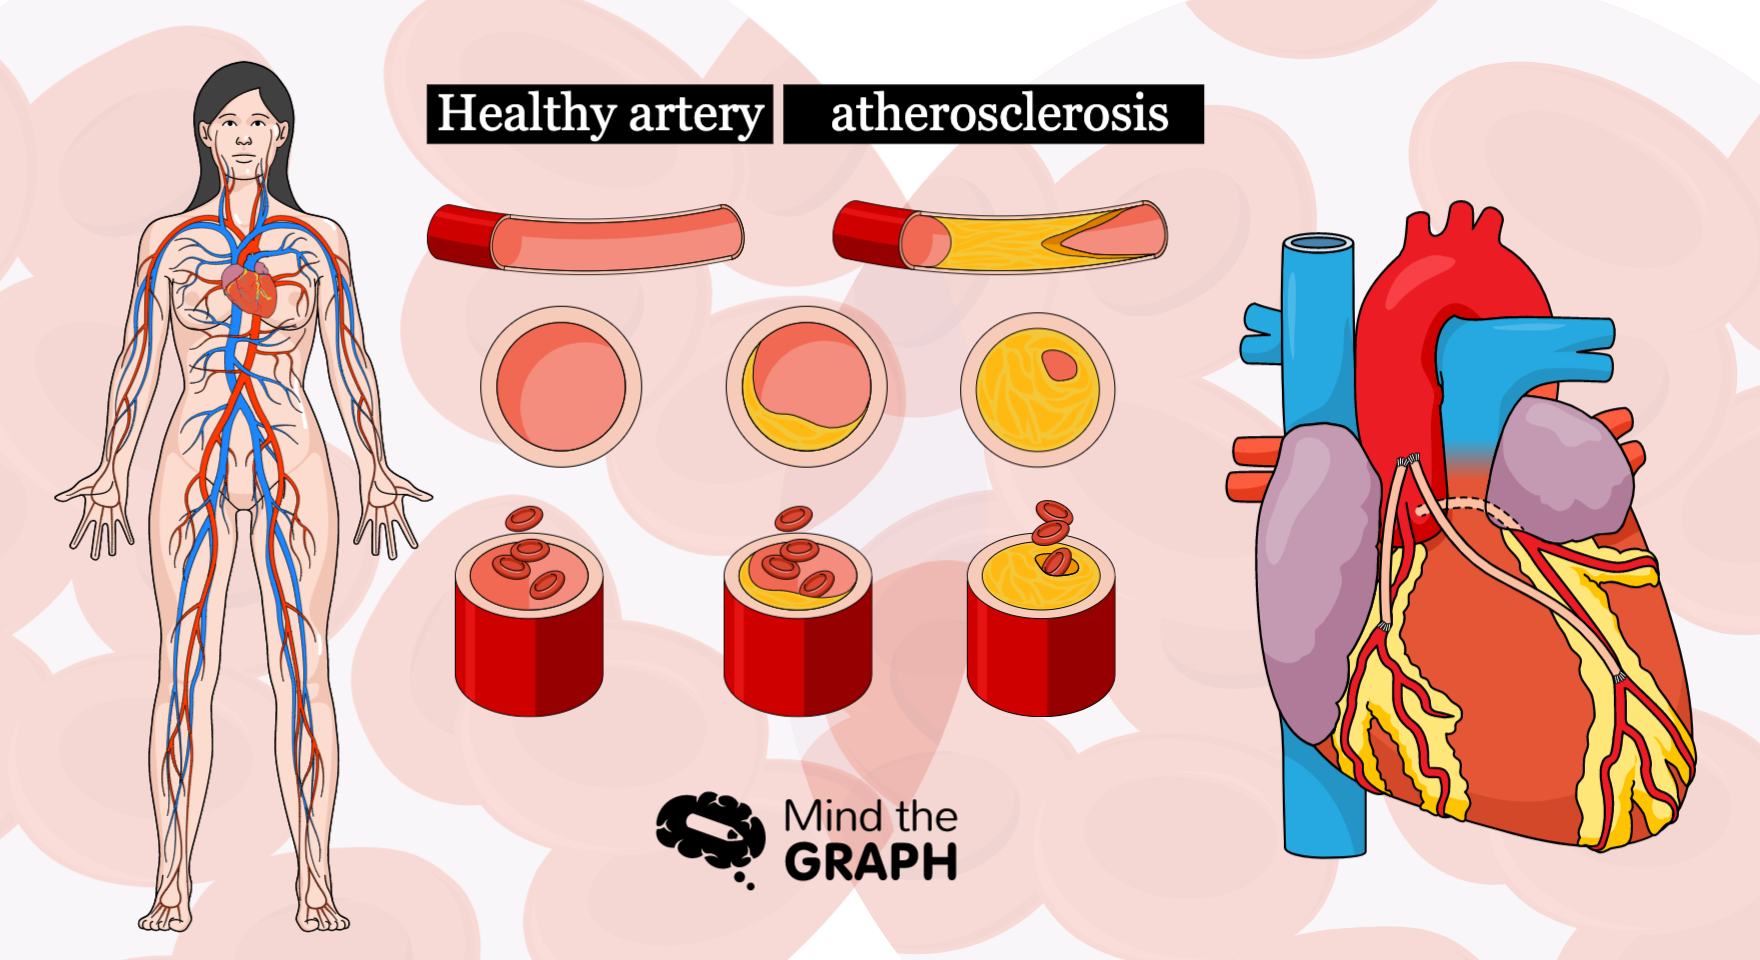
Ateroskleros är ett medicinskt tillstånd i cirkulationssystemet. Det inträffar när plack ackumuleras inuti [...].
Os glóbulos brancos são responsáveis por defender nosso corpo contra ameaças, mantendo-nos vivos. Mas como [...]
Olá! Sexta é dia de mostrar o melhor da nossa semana. Como você deve saber, [...]