As a researcher, getting your work published is only a job half done. It is equally important to immerse your readers in your scientific writing. You can expect more conversations about your research findings when your presentation captures the readers’ attention and conveys information clearly.
In the following article, I’ve highlighted three key steps that can help make your scientific writing more easy-to-understand, concise, and engaging. Read on and find out!
Keeping your message and audience in mind
How do you keep from writing an incomprehensible piece that doesn’t bring much value to your readers?
Understanding your audience’s needs and the message you want to convey is essential for avoiding this circumstance. It’s good to have this at the back of your mind during the initial stages of drafting your piece.
When commencing with your writing, you should ask yourself three questions:
1. Who is your audience?
When writing a research paper or article, especially a scientific one, it’s a good practice to figure out the different sub-groups amongst the audience you are looking to target. For instance, a scientific research paper may interest undergraduate students, PhD scholars, professors, scientists, and others.
Sort these audiences into different groups and list them down. Figure out the answers to each of these questions:
- What do they have in common?
- Where do they differ?
- What is their level of understanding of the topic?
2. What is on their mind?
Once you’ve figured out your target audience, the best way to get them to listen, engage, and act is to put yourself in their shoes and think about how they view your topic and what they care about.
What do they want to know most about the topic? In what form would they like to consume the information? How will the content relate to or interest them? — a quick internet research or a telephonic survey featuring your target audience should help you answer these questions.
3. What needs to be conveyed to them?
While adjusting your message and communication style to suit your target audience, ensure that you stay focused on the core information you want to convey.
Keep the messaging simple and easy to comprehend. In addition, it should be accurate and coherent, with proper transitions between sentences or paragraphs so that your audience finds it easy to understand what you’re trying to say.
In their research titled The Science of Scientific Writing, authors George D. Gopen and Judith. A Swan aptly conveys, “If the reader is to grasp what the writer means, the writer must understand what the reader needs.” This idea should be the foundation for producing engaging scientific writing.
Emphasizing and creating a logical flow
Flow in writing refers to how easily a reader can move through a text, continuing from one idea to the next. It is the impression of smoothness and continuity that a reader experiences when reading a piece of writing.
From a scientific perspective, when the writing is easy-to-follow and has a logical flow, readers will find it simpler to see how the different theories, hypotheses, arguments, models, and findings are connected. They understand how each piece fits into the big picture, what’s important in each section and how it all adds to a coherent whole.
Now the more important question is: How to create a logical flow in your writing?
Use precise and concise words, compose clear sentences that don’t contain unnecessary jargon or technical terms, and create well-structured paragraphs and sound arguments with logical connections. This logical flow ensures clarity and coherence when presenting academic arguments and allows readers to follow along as you explain concepts.
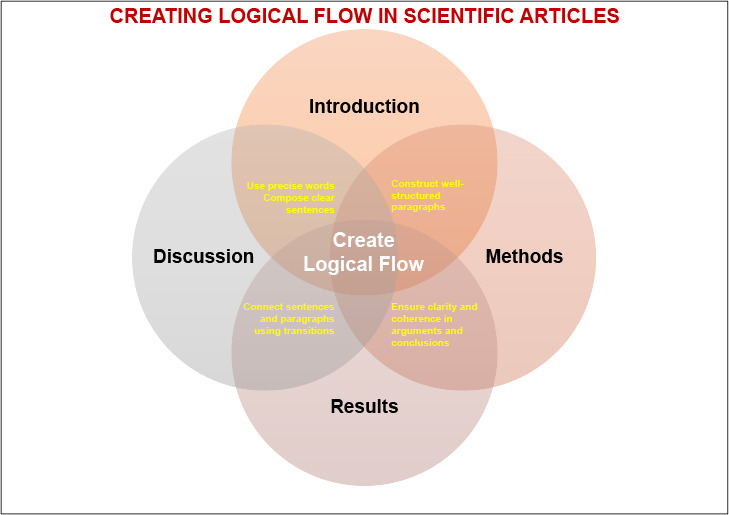
For scientific articles, logical flow is the key to achieving a smooth and orderly progression of ideas, sentences, paragraphs, and content as we reach a convincing conclusion. You can use logical flow to organize your thoughts and make your scientific writing more coherent by following a few fundamental principles:
- Start with an introduction that is brief and includes the research statement – the main idea of your paper.
- Use smooth transitions to connect each paragraph for sections such as methods, results, and discussions.
- End with a conclusion that summarizes what you have written in the rest of the paper.
Explaining concepts through data visualization
Visualizing your experimental or statistical results is critical for your research manuscript.
While it might not seem particularly vital to your study’s outcome, visually presenting these results and findings can do wonders for comprehension — it will definitely come in handy during the review and publication process.
As a result, regardless of the topic or scope of your scientific writing, explaining concepts through figures, graphs, and tables is always a win-win situation.
How does data visualization help?
Figures, graphs, and infographics help break up text and make your work more engaging. They also keep readers engaged by providing an alternative way to process the information, especially when you’ve lengthy technical and complicated text blocks.
Additionally, visuals improve the readability and scannability of your research writing, making it more accessible for the unversed.
For example: Say your research talks about how a new solar panel works. A simple diagram demonstrating how the panel converts sunlight into electricity would make it much easier for the readers to understand the process than theoretically explaining the science involved.
Data visualizations can take different forms, such as bar graphs, frequency histograms, scatterplots, drawings, etc. So when using figures in your academic paper, it is crucial to know when to use what.
You have to consider the kind of data you’ve, where you plan to insert the visual, the presentation format, and the target audience. Knowing these will help you make an appropriate choice. Also, remember the specific rules and limitations for using figures, graphs, and tables set by different publishers.
When creating or using data visualization elements in your research paper, keep the following points in mind:
1. Keep it organized and coherent
The best visualizations blend with the surroundings, enabling viewers to focus on the presented information. They help viewers decipher the data and make meaningful conclusions without disrupting the reading experience.
2. Focus on enhanced readability
Using colors with high contrast or texts to label elements significantly improves readability. Sticking to more basic font types such as serif or sans serif also helps. Similarly, a font size of 16 pixels is ideal for research published on the web.
Have you explored Mind The Graph’s free infographic maker yet? Use the solution to create exceptional graphic assets and illustrations to make your research writing easily understandable.
Better writing for better success
The quality of scientific writing depends significantly on clarity and presenting facts and findings appropriately so that readers can form a clear picture of the concepts in their minds. It is a skill that can be learned, practiced, and improved. With the right approach to writing, you can become an expert at crafting a scientific paper that will catch your readers’ attention and win their favor.
Exclusive scientific content, created by scientists
Explore science like never before by using an amazing infographic tool that makes your research work easy, fun, and presentable. Wait no more and sign up to Mind the Graph for free and enjoy the exclusive scientific content created by scientists to scientists.


Subscribe to our newsletter
Exclusive high quality content about effective visual
communication in science.