
Visual abstracts are the best way to represent scientific information. They help to communicate complex scientific principles for a common (non-scientific) reader. However, it remains a question: where do you find a good Visual Abstract Template? Well, Mind the graph is here with all the template solutions that you need.
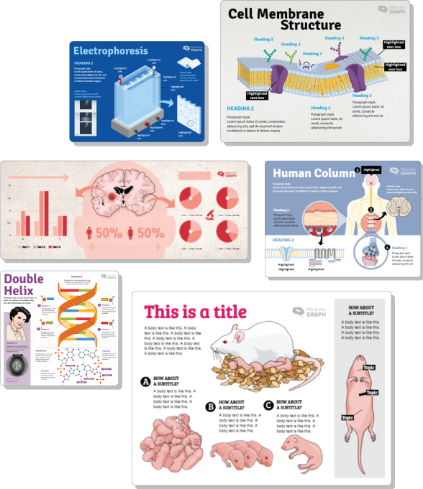
Mind the Graph has developed a pool of visual abstract templates for various categories to help you prepare the best graphics in the scientific community. Let us go through the steps together and prepare your graphics using the Mind The Graph visual abstract template.
Elementer i en visuell abstrakt mal
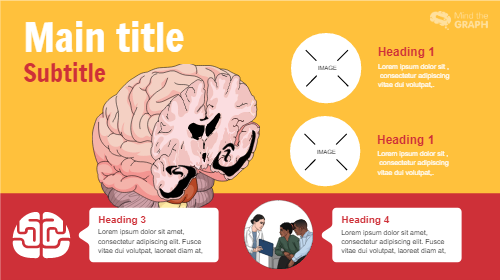
Tittel
Describe the title of your study as the main title. A title should be as clear as possible. Mind the Graph template also gives you the possibility of adding additional text as subtitles. If the template does not show the option it can also be added from the side toolbar “Add Text” A subtitle should provide a brief contest of the study to the reader.
Formål
Mens du arrangerer ulike visuelle elementer, må du sørge for at formålet med studien kommer tydelig frem i teksten. Selv om vi har en tendens til å beskrive metode, resultat og observasjon i ulike overskrifter (1-4), må du ikke gå glipp av formålet med sammendraget.
Viktige punkter
Viktige ideer eller funn kan dekkes under ulike overskrifter. Bruk kortfattede kulepunkter som fremhever hovedbudskapet.
Visuelle elementer
Visual abstract templates from Mind the Graph allows you to access the enormous database of icons and illustrations specifically prepared for the scientific community. Use of images, icons, or graphics to represent key information. We also have a molecular library for the addition of chemical structures.
Attractive color schemes that align with the content can be used to emphasize the research. With great background options change the color and its transparency to suit your style of the graphics and icons.
Vurder å bruke skrifttyper med god lesbarhet
The selection of fonts for a visual abstract is also very important. The template gives you the best-selected font style according to the designer. However, it is always possible to choose something that you use as your research group identifier or your conference, or university requirement. Some journals also could provide you with specifications for visual graphics.
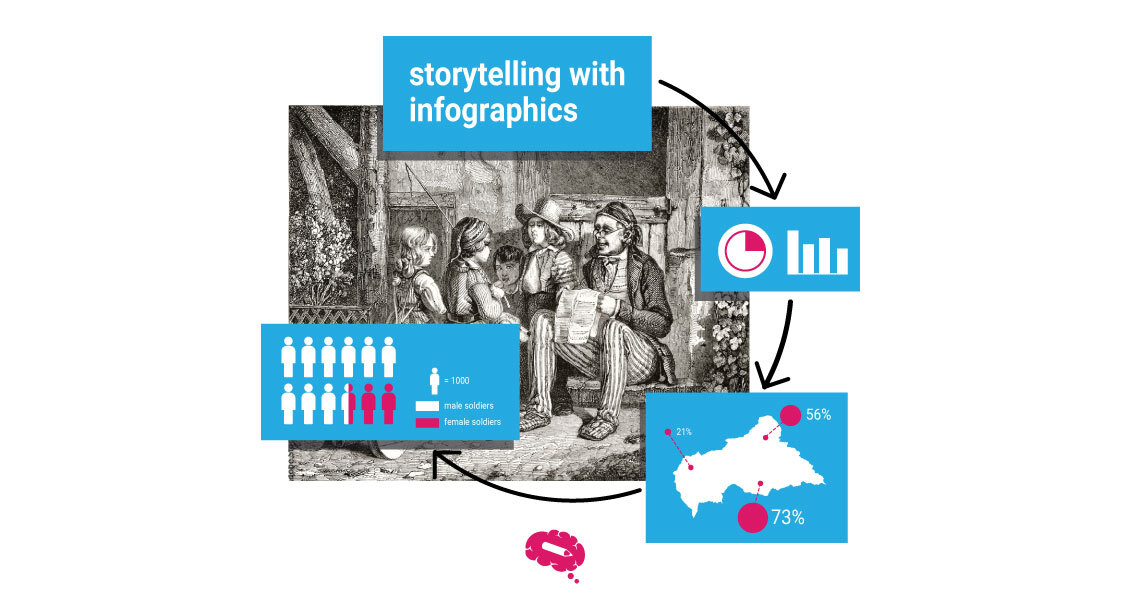
Ønsker du å lage et visuelt blogginnlegg for sosiale medier, kan du lese artikkelen vår her. Les mer om designelementene og utvalget av dem her.
Hvis forskningen din må presenteres med diagrammer eller grafer, kan du laste dem opp og sette dem inn som et bilde. Det finnes også et alternativ for å lage enkle grafer på verktøylinjen.
Trinnvis veiledning for bruk av Mind the Graph Visual Abstract Template
Trinn 1: Opprett konto hos Mind the Graph på Mind the Graph nettsted.
Trinn 2: Select “Infographics Template” from the menu bar.
Trinn 3: Velg hvilken type visuell grafikk du ønsker å lage, fra det store utvalget som designerne våre tilbyr: visuelle abstrakter/grafiske abstrakter, plakater, infografikk og mer.
Trinn 4: Velg malen din, så åpnes et nytt vindu. Med brukervennlige arbeidsverktøy kan du tilpasse tittel, farge, ikoner og tekst i malen.
Trinn 5: Len deg tilbake, slapp av og sett i gang! I løpet av de neste minuttene vil du være klar med en utmerket fremstilling av forskningen din i form av et visuelt sammendrag.
Didn’t Find The Illustration You Need? We’ll Design It For You!
With the “request an illustration” button at the end of the side toolbar, you can request a specific illustration for your visual abstract template. As we did for a lot of researchers, we can prepare customized solutions for you to make sure your presentation is tailor-made. Connect with us and discuss your needs. Our team will reach out to you as soon as they can!
Bli en del av Mind the Graph og få tilgang til en verden av vitenskapelig grafikk sammen med oss! Bli med og minimer tiden du bruker på å utarbeide visuelle sammendrag.


Abonner på nyhetsbrevet vårt
Eksklusivt innhold av høy kvalitet om effektiv visuell
kommunikasjon innen vitenskap.