3 min lesning
09/26/2022
Vitenskapsbloggen Mind The Graph er ment å hjelpe forskere med å lære å kommunisere vitenskap på en ukomplisert måte.
Forstå hva en baksidetekst er, hvorfor den er viktig for bøker, og hvordan du lager en sterk og engasjerende baksidetekst ved hjelp av en enkel 10-trinns guide.
Forstå hvilke typer forskningslaboratorier som finnes, hva som kjennetegner dem, og få smarte tips om hvordan du blir forsker på et laboratorium.
Lær om potensielle begrensninger i forskningen og hvordan du kan håndtere dem på en hensiktsmessig måte for å levere ærlig og etisk forskning.
I denne artikkelen lærer du hvordan du kan finne lignende forskningsartikler for å identifisere forskningsgapet og gå videre med forskningen på en effektiv måte.
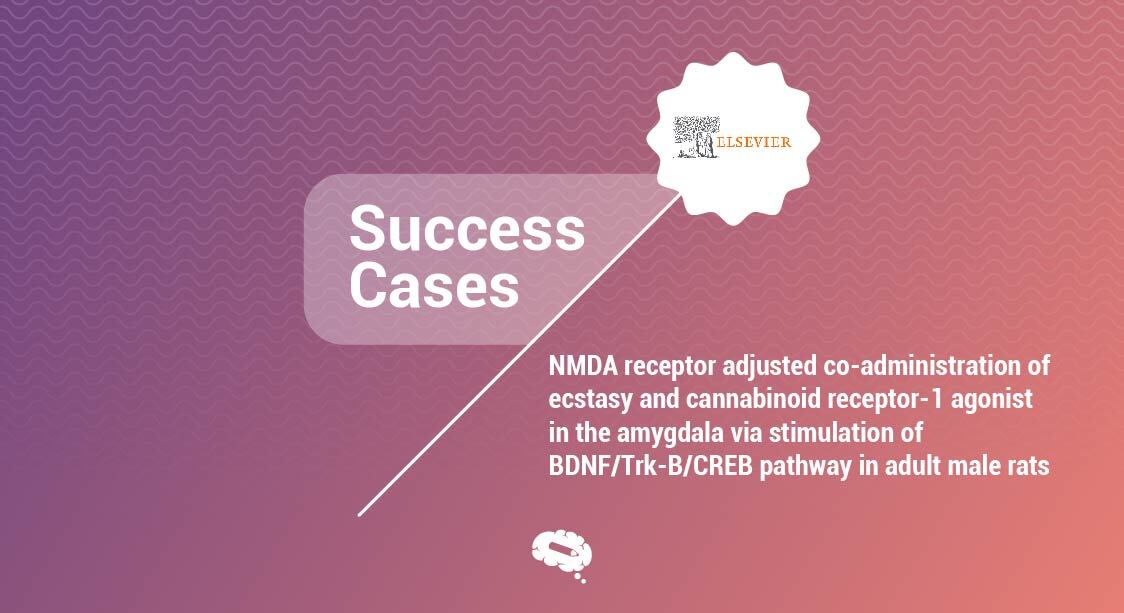
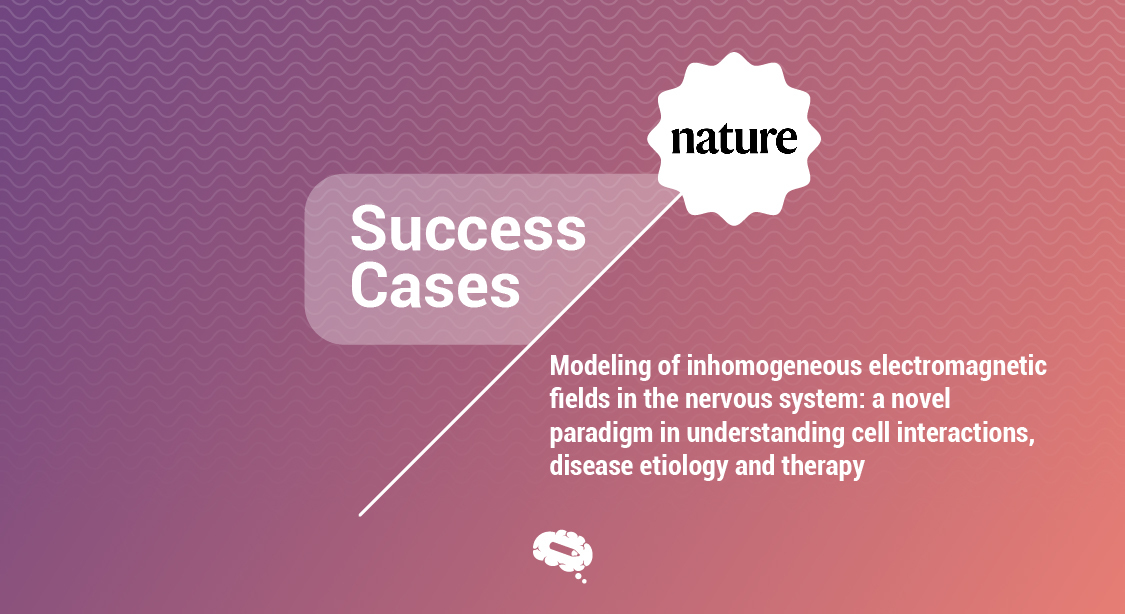
Lær av dem som allerede har oppdaget kraften i infografikk. Denne artikkelen inneholder grafiske sammendrag laget med Mind the Graph.
Sjekk denne enkle 5-trinnsveiledningen som gir deg fascinerende innsikt i hvordan og hva du skal kalle forskningsoppgaven din.
I denne enkle artikkelen får du vite mer om preprint-artikler, hvordan de kan være til hjelp for forskningen din og hvor viktige de er.
Det er på tide å lære seg forskjellen mellom et grafisk abstrakt og en infografikk, og hvordan du bruker begge deler.
Lær av dem som allerede har oppdaget kraften i infografikk. Denne artikkelen inneholder grafiske sammendrag laget med Mind the Graph.
Pandemien tvang mange til å revurdere karriere og livsstil. I denne artikkelen undersøker vi hvordan akademikere har blitt påvirket.
I denne artikkelen kan du lese mer om det grunnleggende om tidsskriftindeksering, hvorfor det er så viktig, og hvilke databaser du bør bruke.
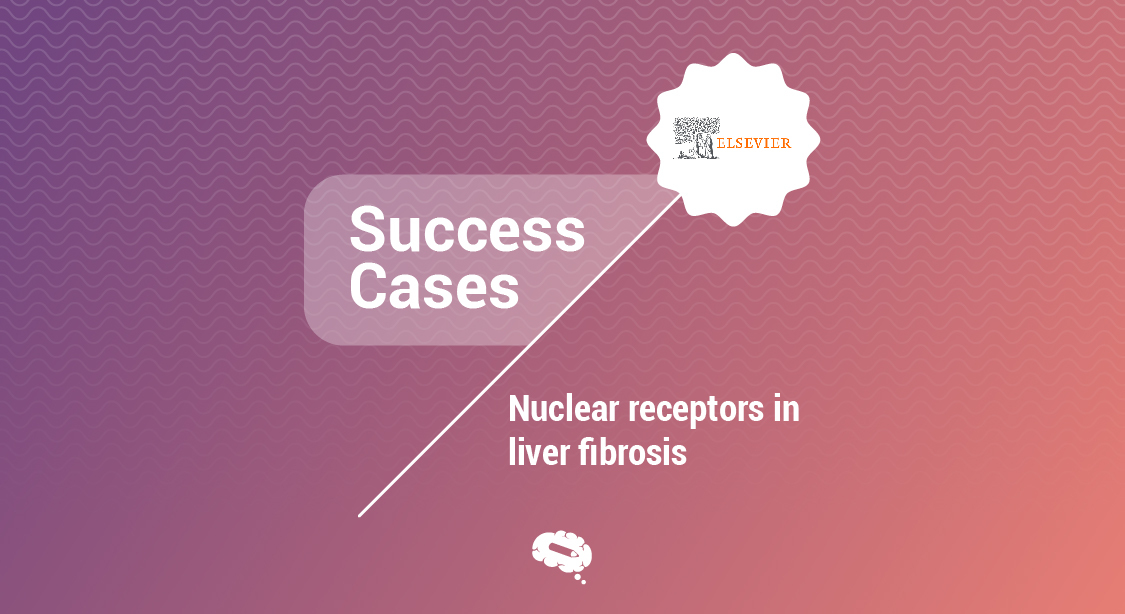
Denne artikkelen inneholder vitenskapelige illustrasjoner laget med Mind the Graph for å representere nukleære reseptorer i leverfibrose.
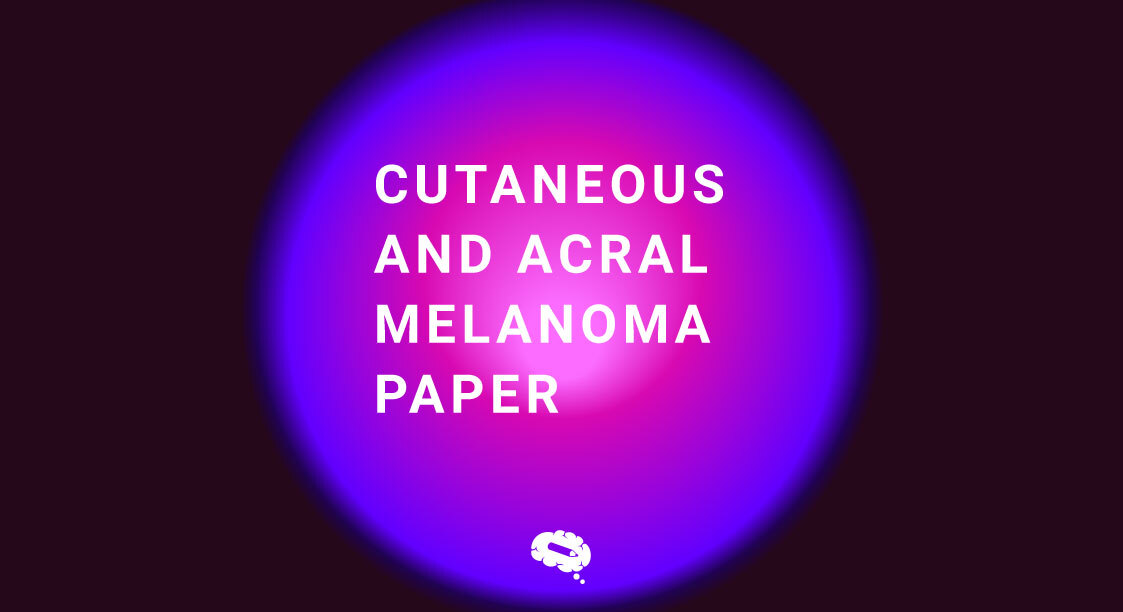
Denne artikkelen diskuterer de prognostiske kreftdriverne knyttet til patobiologi og ultrafiolett eksponering sammen med forfatterens innsikt.