4 min lesning
05/15/2019
Vitenskapsbloggen Mind The Graph er ment å hjelpe forskere med å lære å kommunisere vitenskap på en ukomplisert måte.
Vitenskap må handle om nysgjerrighet og spørsmål, ikke om dogmer og fasitsvar. Lærerne må altså gjøre mer enn å undervise mot teorien om den flate jorda. Vi må undervise i den vitenskapelige metoden med å stille hypoteser, gjøre eksperimenter for å utforske observasjoner og svare på spørsmål. En fysikklærer, Rhett Allain, skrev om hvordan man kan undervise i den heliosentriske teorien, eller med andre ord [...].
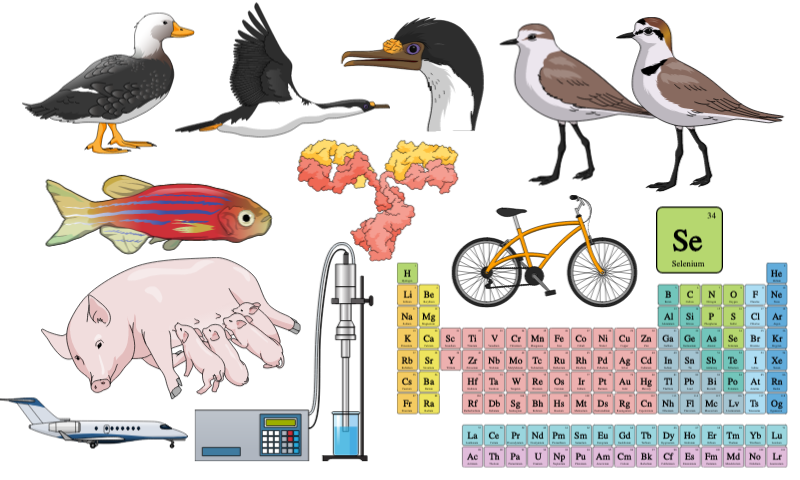
Det er på tide å vise de nye vitenskapelige illustrasjonene fra Mind the Graph. Som du vet, [...]
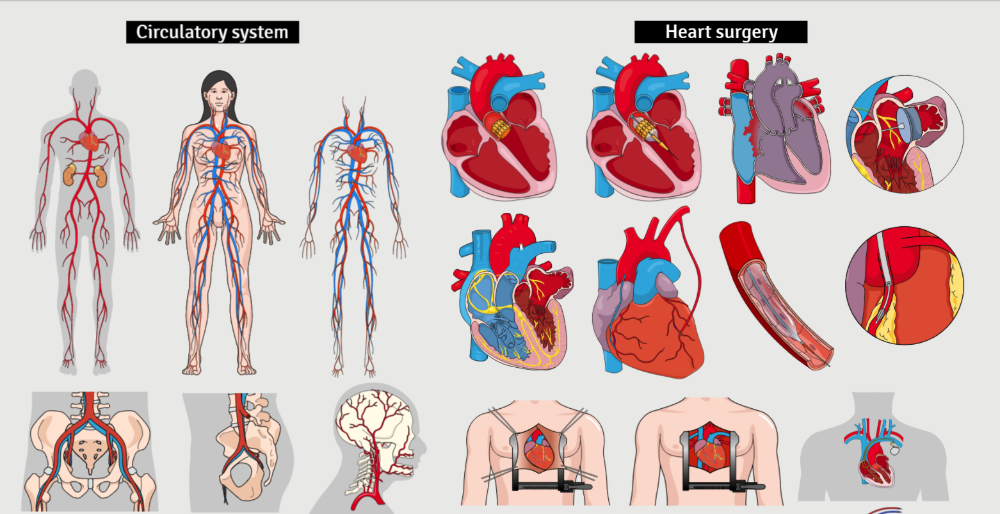
Det er ikke enkelt å være lege. Além de estar constantemente atualizado sobre novos procedimentos e tecnologia, [...].
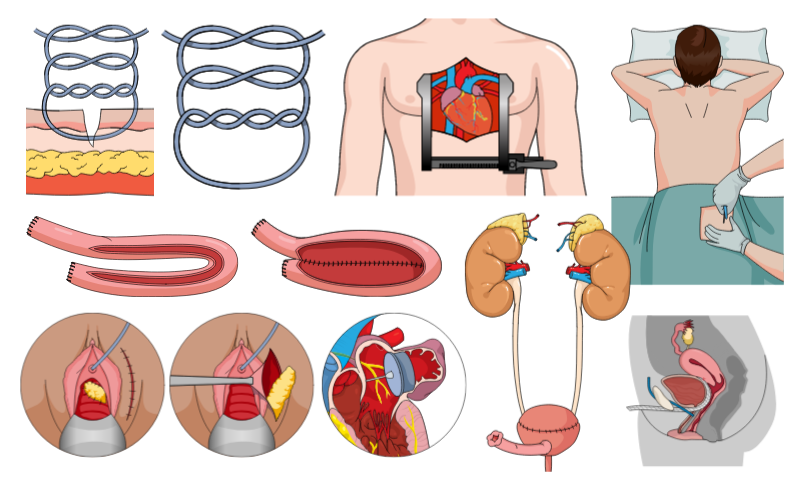
Bilder av sykdommer i sirkulasjonssystemet, for eksempel hjerteskader, er svært nyttige for pasienter og foreldre [...].
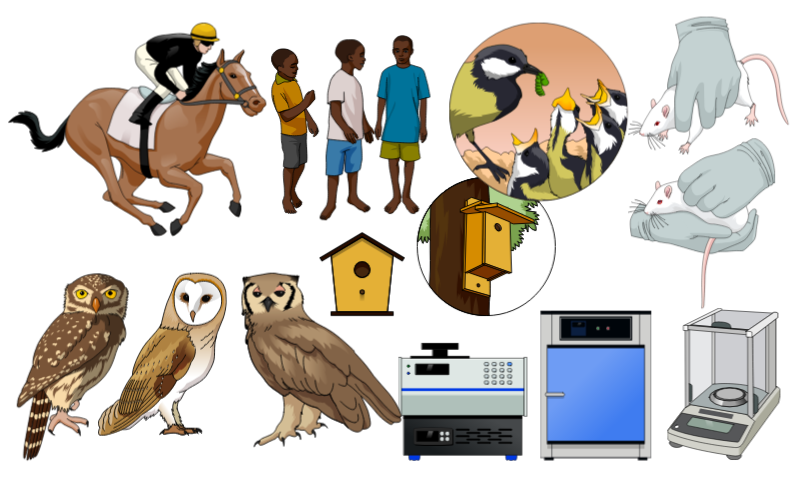
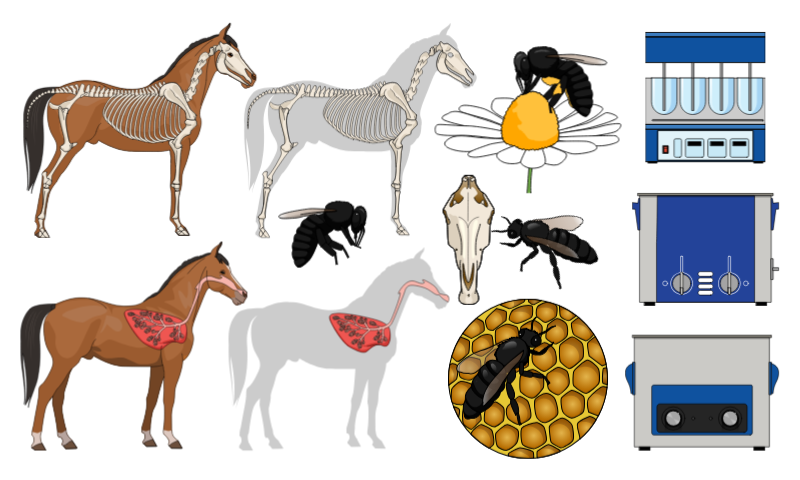
Det er vanlig å bruke to eller tre forskjellige arter i et forsøk. I tillegg til det, [...]
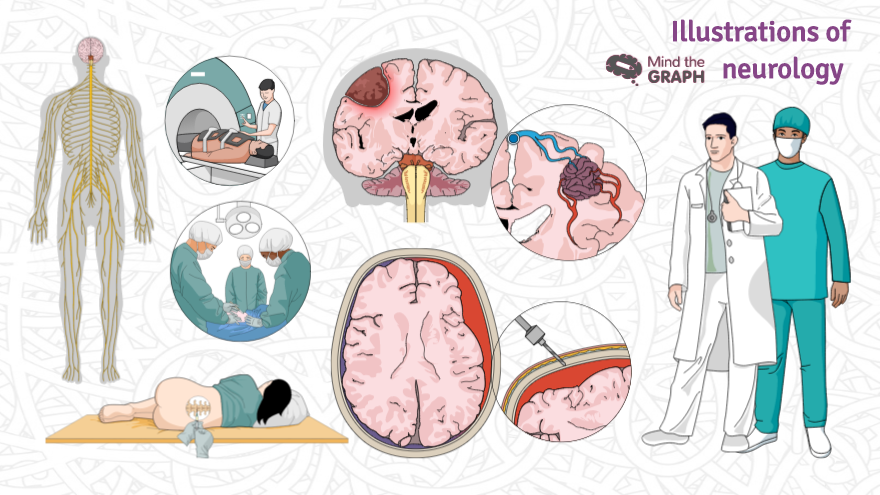
Os distúrbios neurológicos são doenças do cérebro, da coluna e dos nervos que os conectam. [...]
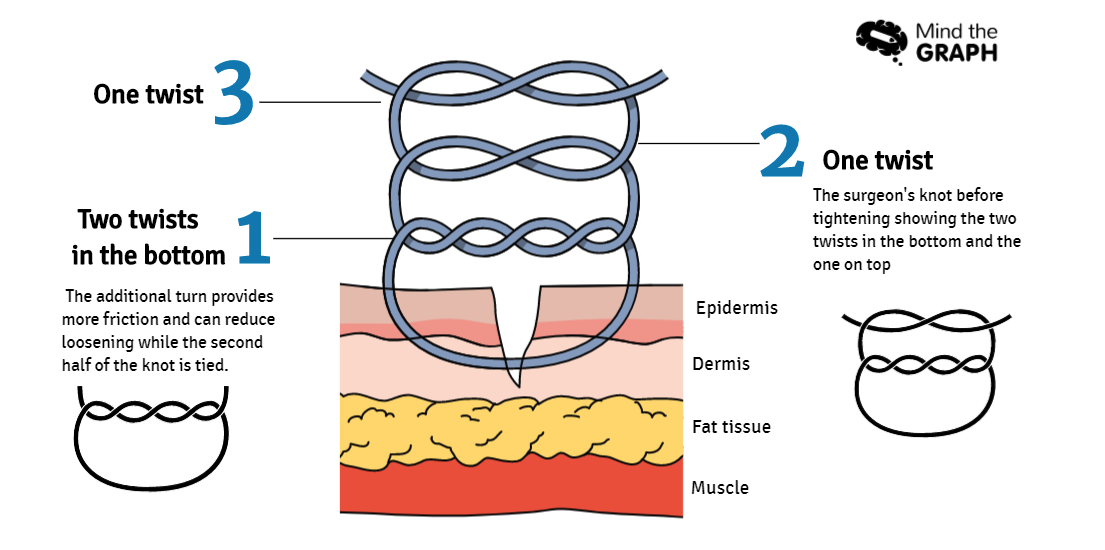
Hvordan presenterer du kirurgiske prosedyrer i undervisning og presentasjoner? Det er ikke alltid like lett [...].
Det er fredag igjen (YAY), så det er på tide å se de nye vitenskapelige illustrasjonene av [...].
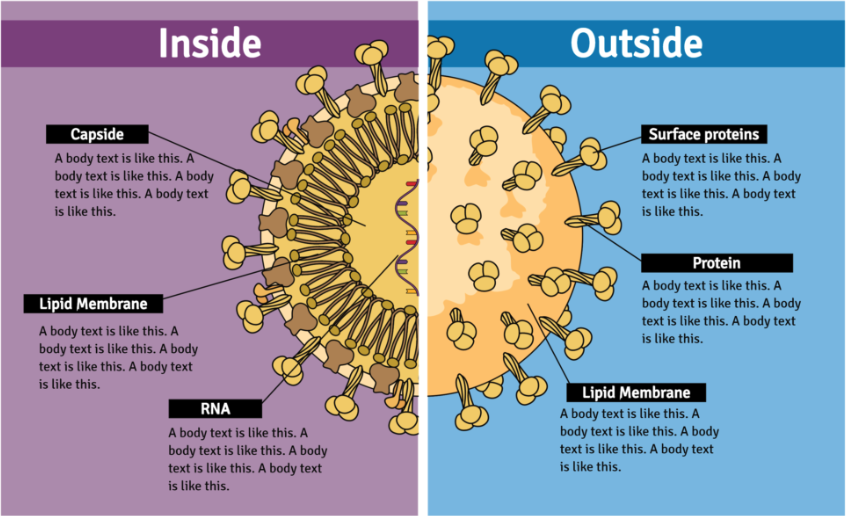
Som lege vet du sikkert hvor viktig det er å kommunisere godt med pasientene dine. De [...]
Et visuelt abstrakt er ikke lett å skape, men det er kommet for å bli. Så vi har alltid [...]
Hei, det er fredag igjen (YAY), og det er på tide å se de nye vitenskapelige illustrasjonene av [...].
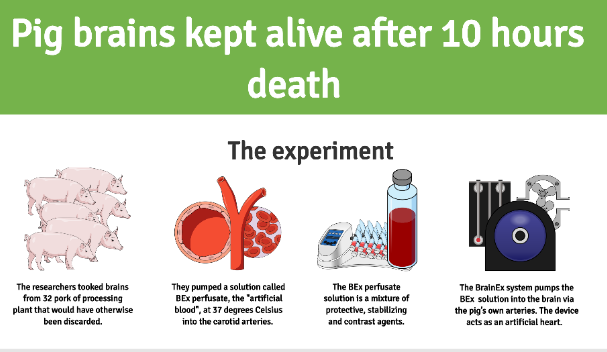
Forskere fra Yale University holdt grisehjerner i live utenfor kroppen i flere timer etter døden. De [...]
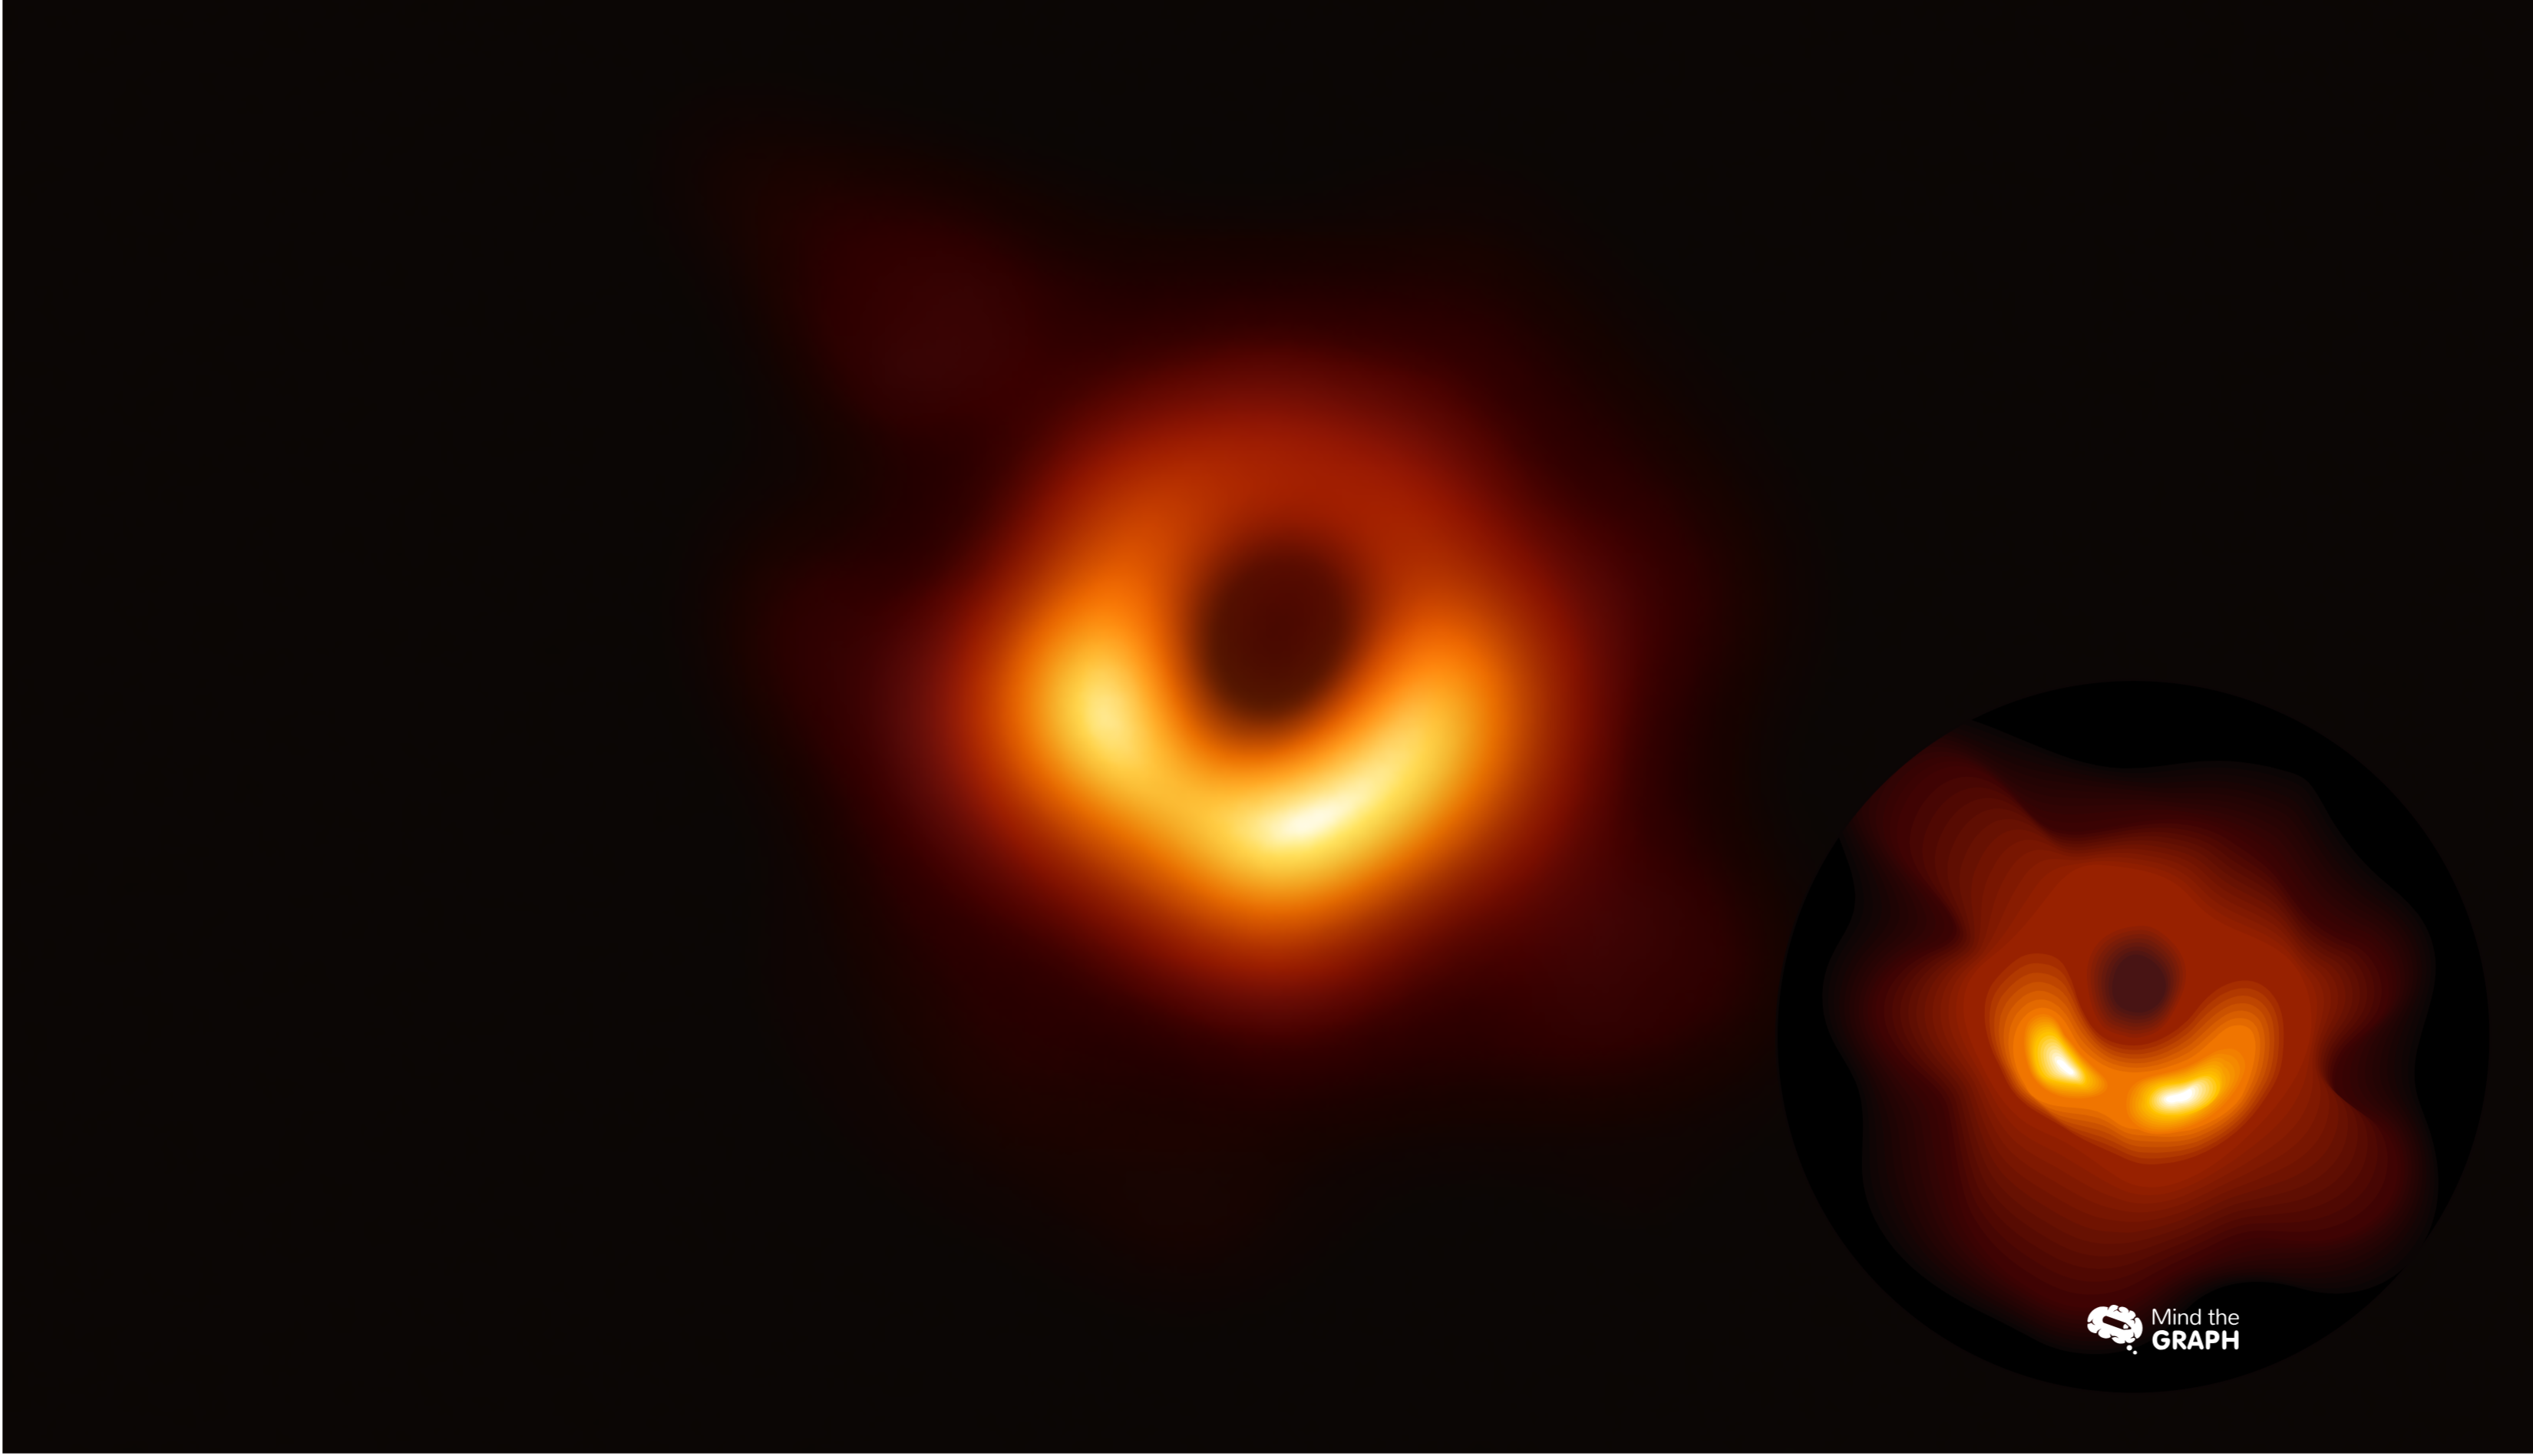
De siste dagene har vært spennende for alle forskere og vitenskapsentusiaster. Vi så for [...]