3 min lesning
08/28/2018
Vitenskapsbloggen Mind The Graph er ment å hjelpe forskere med å lære å kommunisere vitenskap på en ukomplisert måte.
Når alt arbeidet er gjort og gjennomgått et par hundre ganger, kommer det etterlengtede øyeblikket: det er på tide å sende inn den vitenskapelige artikkelen! Det er en lang og velkjent vei. Men sjansene for at artikkelen din blir akseptert på første forsøk er små, så du må forberede deg på de følgende trinnene: La oss ta en nærmere titt på [...].
Hvis du tror at det å publisere en artikkel er den eneste måten å gjøre [...].
Når temaet er informasjon, er det ingen trend å kombinere tall og tekst. Å kalle det infografikk er [...].
Referanse innen datavisualisering, Alberto Cairo er et av de største navnene når det gjelder [...].
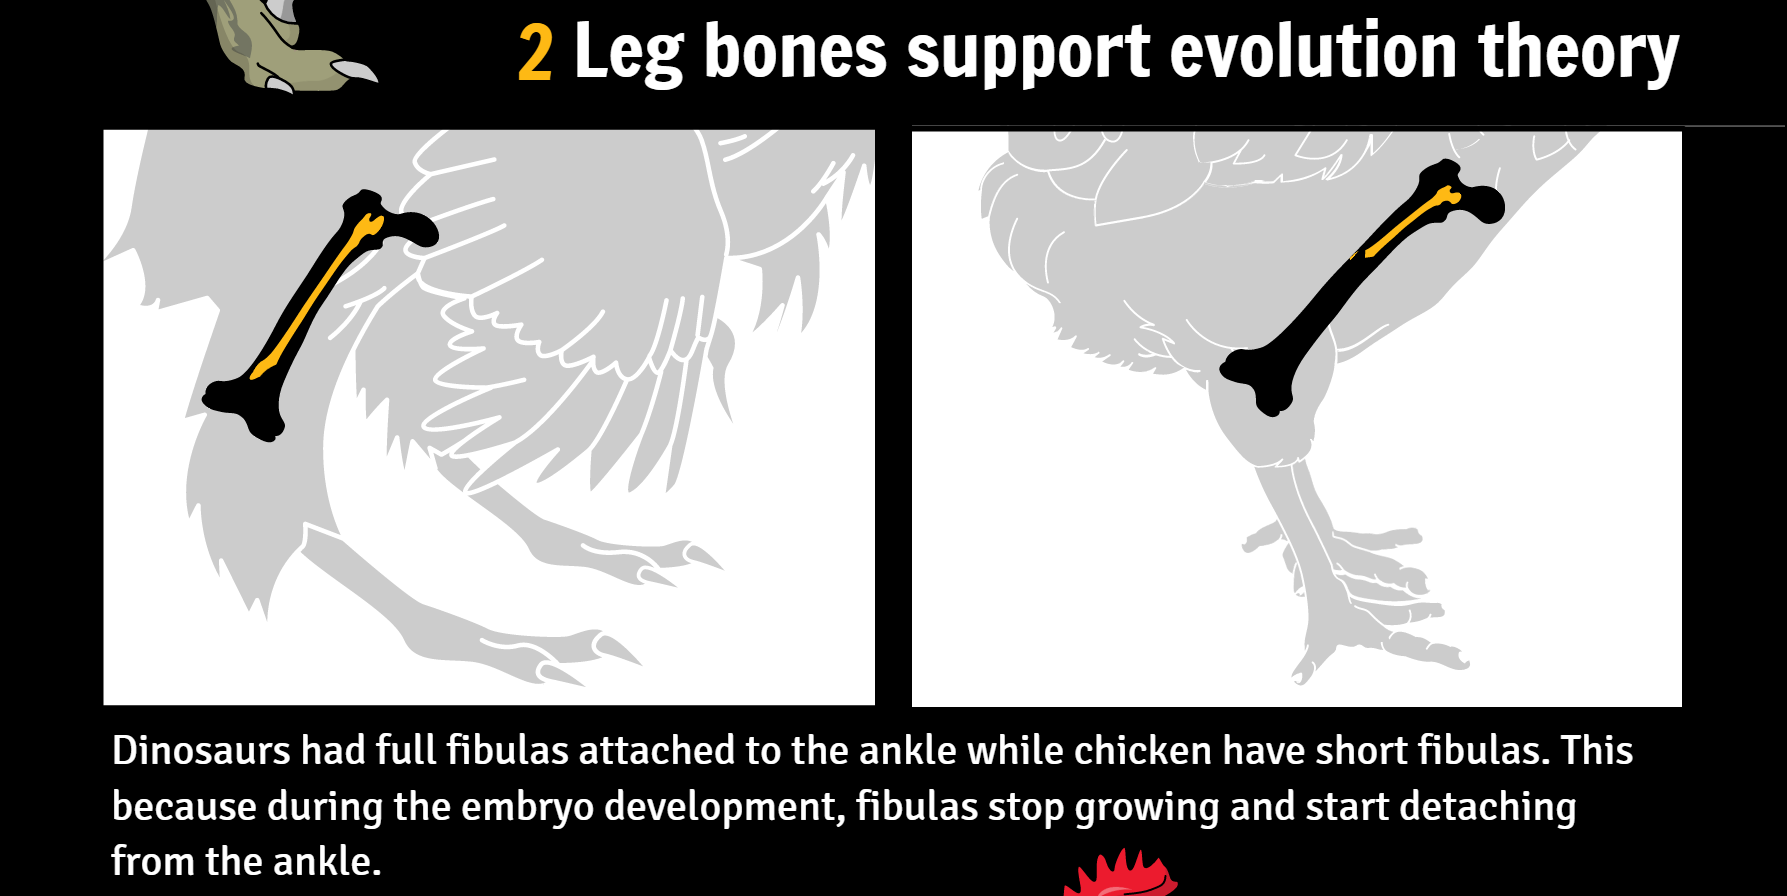
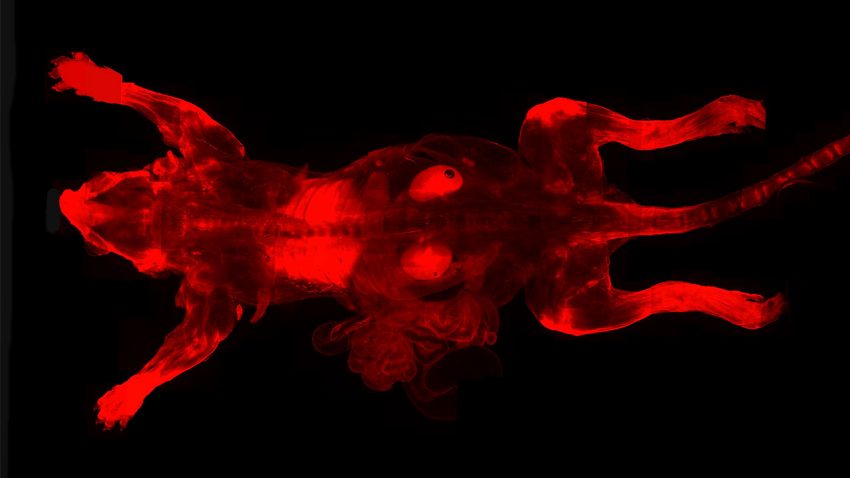
I forrige uke publiserte Botelho et al. en ny forskningsrapport om genmanipulering hos kylling. Deres [...]
Science fiction-filmer har gitt oss håp om å utvikle superkrefter som usynlighet, superstyrke [...].
Paris, Frankrike og San Diego, California (27. oktober 2016) - AgileBio, en ledende global leverandør av [...]
Isaac Newton 45 år gammel - Publiserte Philosophiae Naturalis Principia Mathematica (Matematiske prinsipper for [...])
Det er alltid en fest når vi ser det fantastiske arbeidet til brukerne våre. Jeg har allerede skrevet om [...]
Å være forsker er ingen enkel oppgave. Selvstendigheten ved å ha sitt eget arbeid kommer [...].
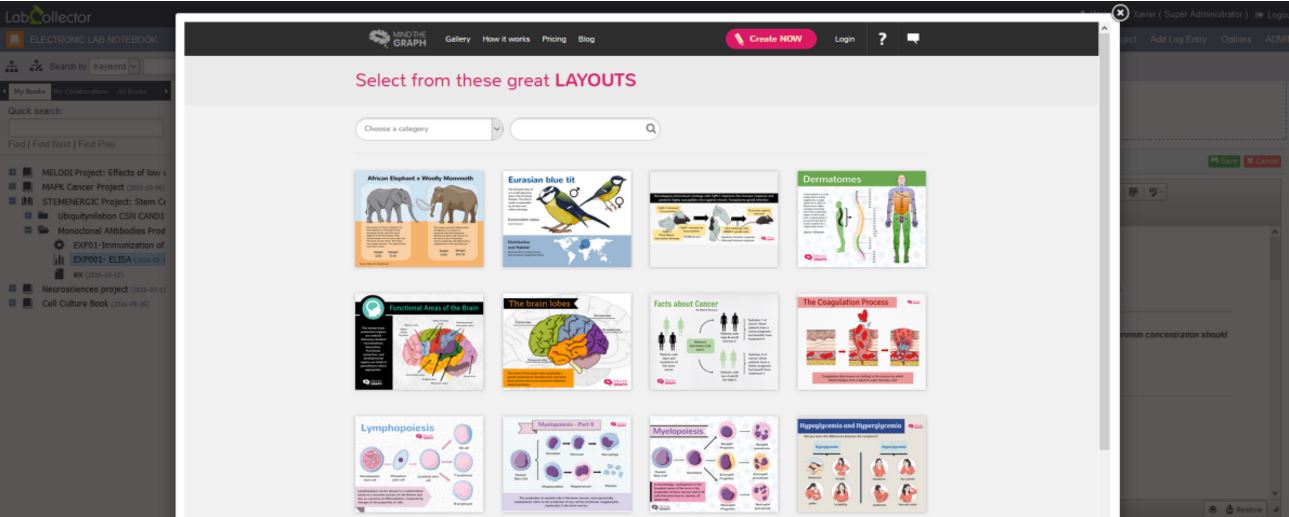
Det første inntrykket Mind the Graph-brukere får når de logger inn på plattformen vår, er: [...].
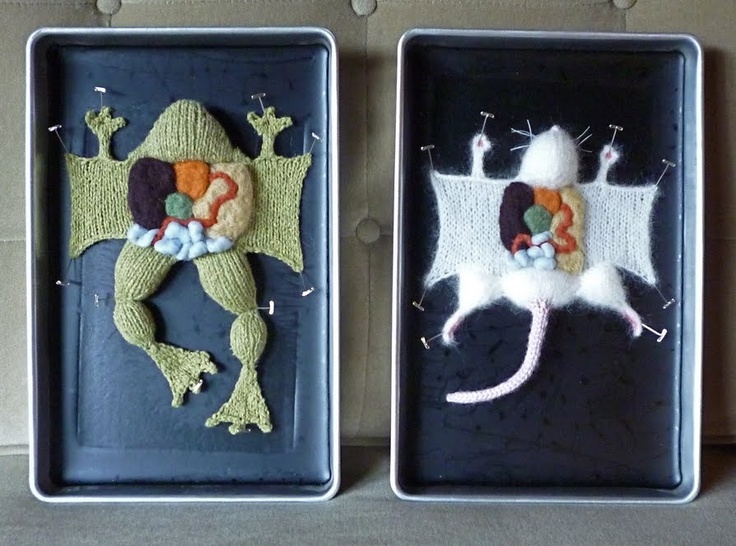
Når det gjelder vitenskapelig kunst, tenker de fleste av oss umiddelbart på superrealistiske og [...]...
Gabriela Trevisan har doktorgrad i biologi og har spesialisert seg på smerte og betennelsesprosesser. Hennes [...]