Hypothesis testing is a fundamental tool used in scientific research to validate or reject hypotheses about population parameters based on sample data. It provides a structured framework for evaluating the statistical significance of a hypothesis and drawing conclusions about the true nature of a population. Hypothesis testing is widely used in fields such as biology, psychology, economics, and engineering to determine the effectiveness of new treatments, explore relationships between variables, and make data-driven decisions. However, despite its importance, hypothesis testing can be a challenging topic to understand and apply correctly.
In this article, we will provide an introduction to hypothesis testing, including its purpose, types of tests, steps involved, common errors, and best practices. Whether you are a beginner or an experienced researcher, this article will serve as a valuable guide to mastering hypothesis testing in your work.
Introduction to Hypothesis Testing
Hypothesis testing is a statistical tool that is commonly used in research to determine whether there is enough evidence to support or reject a hypothesis. It involves formulating a hypothesis about a population parameter, collecting data, and analyzing the data to determine the likelihood of the hypothesis being true. It is a critical component of the scientific method, and it is used in a wide range of fields.
The process of hypothesis testing typically involves two hypotheses: the null hypothesis and the alternative hypothesis. The null hypothesis is a statement that there is no significant difference between two variables or no relationship between them, while the alternative hypothesis suggests the presence of a relationship or difference. Researchers collect data and perform statistical analysis to determine if the null hypothesis can be rejected in favor of the alternative hypothesis.
Hypothesis testing is used to make decisions based on data, and it is important to understand the underlying assumptions and limitations of the process. It is crucial to choose appropriate statistical tests and sample sizes to ensure that the results are accurate and reliable, and it can be a powerful tool for researchers to validate their theories and make evidence-based decisions.

Types of Hypothesis Tests
Hypothesis testing can be broadly classified into two categories: one-sample hypothesis tests and two-sample hypothesis tests. Let’s take a closer look at each of these categories:
One Sample Hypothesis Tests
In a one-sample hypothesis test, a researcher collects data from a single population and compares it to a known value or hypothesis. The null hypothesis usually assumes that there is no significant difference between the population means and the known value or hypothesized value. The researcher then performs a statistical test to determine whether the observed difference is statistically significant. Some examples of one-sample hypothesis tests are:
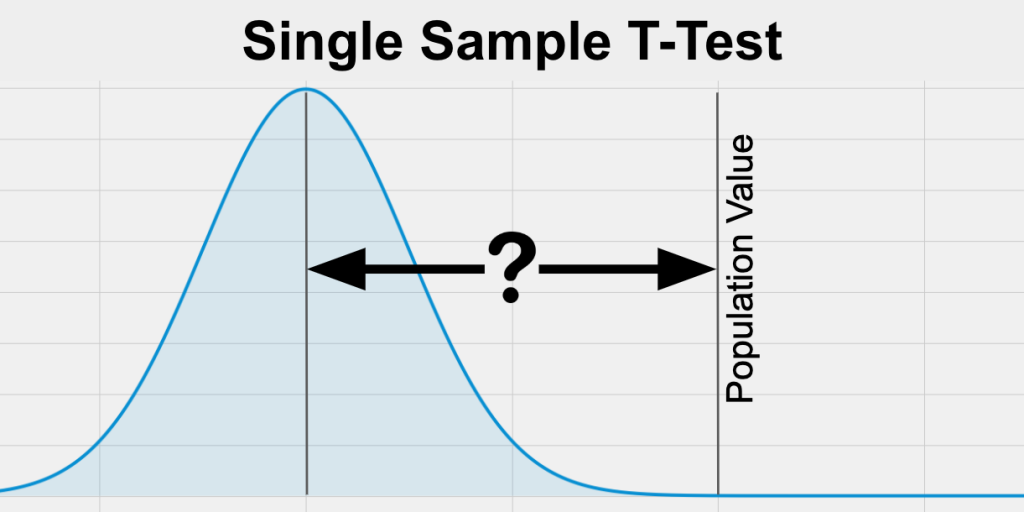
One Sample t-test: This test is used to determine whether the sample mean is significantly different from the hypothesized mean of the population.
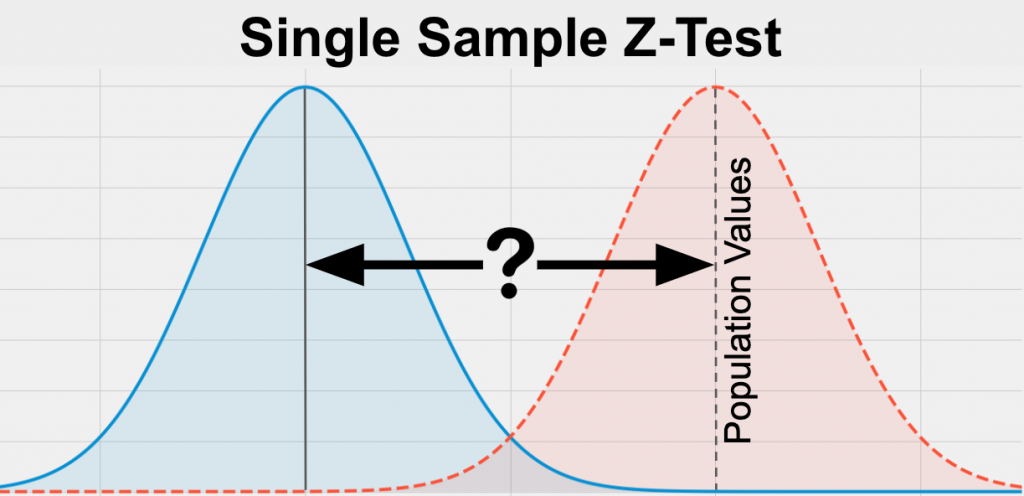
One Sample z-test: This test is used to determine whether the sample mean is significantly different from the hypothesized mean of the population when the population standard deviation is known.
Two Sample Hypothesis Tests
In a two-sample hypothesis test, a researcher collects data from two different populations and compares them to each other. The null hypothesis typically assumes that there is no significant difference between the two populations, and the researcher performs a statistical test to determine whether the observed difference is statistically significant. Some examples of two sample hypothesis tests are:
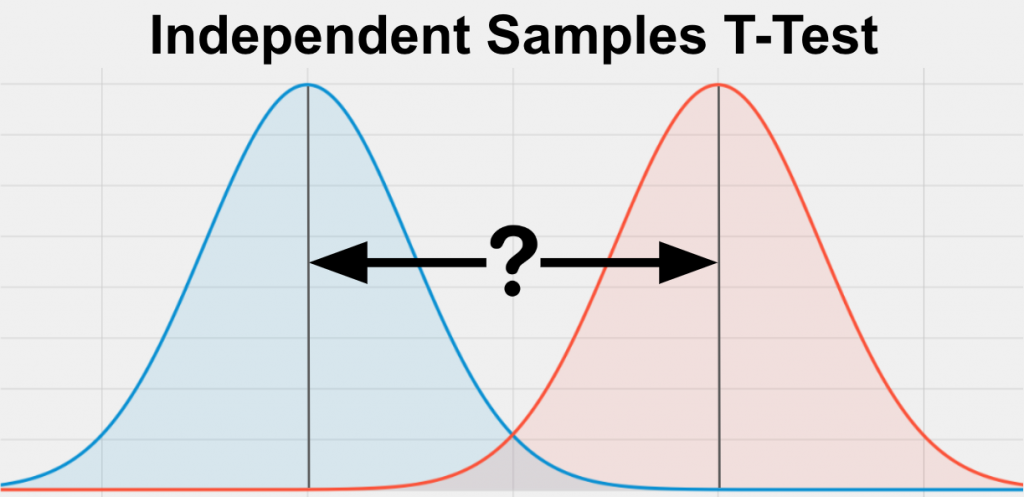
Independent Samples t-test: This test is used to compare the means of two independent samples to determine whether they are significantly different from each other.
Paired Samples t-test: This test is used to compare the means of two related samples, such as pre-test and post-test scores of the same group of subjects.
Figure: https://statstest.b-cdn.net/wp-content/uploads/2020/10/Paired-Samples-T-Test.jpg
In summary, one-sample hypothesis tests are used to test hypotheses about a single population, while two-sample hypothesis tests are used to compare two populations. The appropriate test to use depends on the nature of the data and the research question being investigated.
Steps of Hypothesis Testing
Hypothesis testing involves a series of steps that help researchers determine whether there is enough evidence to support or reject a hypothesis. These steps can be broadly classified into four categories:
Formulating the Hypothesis
The first step in hypothesis testing is to formulate the null hypothesis and alternative hypothesis. The null hypothesis usually assumes that there is no significant difference between two variables, while the alternative hypothesis suggests the presence of a relationship or difference. It is important to formulate clear and testable hypotheses before proceeding with data collection.
Collecting Data
The second step is to collect relevant data that can be used to test the hypotheses. The data collection process should be carefully designed to ensure that the sample is representative of the population of interest. The sample size should be large enough to produce statistically valid results.
Analyzing Data
The third step is to analyze the data using appropriate statistical tests. The choice of test depends on the nature of the data and the research question being investigated. The results of the statistical analysis will provide information on whether the null hypothesis can be rejected in favor of the alternative hypothesis.
Interpreting Results
The final step is to interpret the results of the statistical analysis. The researcher needs to determine whether the results are statistically significant and whether they support or reject the hypothesis. The researcher should also consider the limitations of the study and the potential implications of the results.
Common Errors in Hypothesis Testing
Hypothesis testing is a statistical method used to determine if there is enough evidence to support or reject a specific hypothesis about a population parameter based on a sample of data. The two types of errors that can occur in hypothesis testing are:
Type I error: This occurs when the researcher rejects the null hypothesis even though it is true. Type I error is also known as a false positive.
Type II error: This occurs when the researcher fails to reject the null hypothesis even though it is false. Type II error is also known as a false negative.
To minimize these errors, it is important to carefully design and conduct the study, choose appropriate statistical tests, and properly interpret the results. Researchers should also acknowledge the limitations of their study and consider the potential sources of error when drawing conclusions.
Null and Alternative Hypotheses
In hypothesis testing, there are two types of hypotheses: null hypothesis and alternative hypothesis.
The Null Hypothesis
The null hypothesis (H0) is a statement that assumes there is no significant difference or relationship between two variables. It is the default hypothesis that is assumed to be true until there is sufficient evidence to reject it. The null hypothesis is often written as a statement of equality, such as “the mean of Group A is equal to the mean of Group B.”
The Alternative Hypothesis
The alternative hypothesis (Ha) is a statement that suggests the presence of a significant difference or relationship between two variables. It is the hypothesis that the researcher is interested in testing. The alternative hypothesis is often written as a statement of inequality, such as “the mean of Group A is not equal to the mean of Group B.”
The null and alternative hypotheses are complementary and mutually exclusive. If the null hypothesis is rejected, the alternative hypothesis is accepted. If the null hypothesis cannot be rejected, the alternative hypothesis is not supported.
It is important to note that the null hypothesis is not necessarily true. It is simply a statement that assumes there is no significant difference or relationship between the variables being studied. The purpose of hypothesis testing is to determine whether there is sufficient evidence to reject the null hypothesis in favor of the alternative hypothesis.
Significance Level and P Value
In hypothesis testing, the significance level (alpha) is the probability of making a Type I error, which is rejecting the null hypothesis when it is actually true. The most commonly used significance level in scientific research is 0.05, meaning that there is a 5% chance of making a Type I error.
The p-value is a statistical measure that indicates the probability of obtaining the observed results or more extreme results if the null hypothesis is true. It is a measure of the strength of evidence against the null hypothesis. A small p-value (typically less than the chosen significance level of 0.05) suggests that there is strong evidence against the null hypothesis, while a large p-value suggests that there is not enough evidence to reject the null hypothesis.
If the p-value is less than the significance level (p < alpha), then the null hypothesis is rejected and the alternative hypothesis is accepted. This means that there is sufficient evidence to suggest that there is a significant difference or relationship between the variables being studied. On the other hand, if the p-value is greater than the significance level (p > alpha), then the null hypothesis is not rejected and the alternative hypothesis is not supported.
If you want an easy-to-understand summary of the significance level, you will find it in this article: An easy-to-understand summary of significance level.
It is important to note that statistical significance does not necessarily imply practical significance or importance. A small difference or relationship between variables may be statistically significant but may not be practically significant. Additionally, statistical significance depends on sample size and effect size, among other factors, and should be interpreted in the context of the study design and research question.
Power Analysis for Hypothesis Testing
Power analysis is a statistical method used in hypothesis testing to determine the sample size needed to detect a specific effect size with a certain level of confidence. The power of a statistical test is the probability of correctly rejecting the null hypothesis when it is false or the probability of avoiding a Type II error.
Power analysis is important because it helps researchers determine the appropriate sample size needed to achieve a desired level of power. A study with low power may fail to detect a true effect, leading to a Type II error, while a study with high power is more likely to detect a true effect, leading to more accurate and reliable results.
To conduct a power analysis, researchers need to specify the desired power level, significance level, effect size, and sample size. Effect size is a measure of the magnitude of the difference or relationship between variables being studied, and is typically estimated from previous research or pilot studies. The power analysis can then determine the necessary sample size needed to achieve the desired power level.
Power analysis can also be used retrospectively to determine the power of a completed study, based on the sample size, effect size, and significance level. This can help researchers evaluate the strength of their conclusions and determine whether additional research is needed.
Overall, power analysis is an important tool in hypothesis testing, as it helps researchers design studies that are adequately powered to detect true effects and avoid Type II errors
Bayesian Hypothesis Testing
Bayesian hypothesis testing is a statistical method that allows researchers to evaluate the evidence for and against competing hypotheses, based on the likelihood of the observed data under each hypothesis, as well as the prior probability of each hypothesis. Unlike classical hypothesis testing, which focuses on rejecting null hypotheses based on p-values, Bayesian hypothesis testing provides a more nuanced and informative approach to hypothesis testing, by allowing researchers to quantify the strength of evidence for and against each hypothesis.
In Bayesian hypothesis testing, researchers start with a prior probability distribution for each hypothesis, based on existing knowledge or beliefs. They then update the prior probability distribution based on the likelihood of the observed data under each hypothesis, using Bayes’ theorem. The resulting posterior probability distribution represents the probability of each hypothesis, given the observed data.
The strength of evidence for one hypothesis versus another can be quantified by calculating the Bayes factor, which is the ratio of the likelihood of the observed data under one hypothesis versus another, weighted by their prior probabilities. A Bayes factor greater than 1 indicates evidence in favor of one hypothesis, while a Bayes factor less than 1 indicates evidence in favor of the other hypothesis.
Bayesian hypothesis testing has several advantages over classical hypothesis testing. First, it allows researchers to update their prior beliefs based on observed data, which can lead to more accurate and reliable conclusions. Second, it provides a more informative measure of evidence than p-values, which only indicate whether the observed data is statistically significant at a predetermined level. Finally, it can accommodate complex models with multiple parameters and hypotheses, which may be difficult to analyze using classical methods.
Overall, Bayesian hypothesis testing is a powerful and flexible statistical method that can help researchers make more informed decisions and draw more accurate conclusions from their data.
Make Scientifically Accurate Infographics in Minutes
Mind the Graph platform is a powerful tool that helps scientists create scientifically accurate infographics in an easy way. With its intuitive interface, customizable templates, and extensive library of scientific illustrations and icons, Mind the Graph makes it easy for researchers to create professional-looking graphics that effectively communicate their findings to a broader audience.


Subscribe to our newsletter
Exclusive high quality content about effective visual
communication in science.