Creating an effective graphical abstract is a crucial skill for researchers, especially when aiming to publish in prestigious journals. A well-crafted graphical abstract not only summarizes the key findings of your research but also captures the attention of readers, making your work more accessible and impactful.
In this article, we will guide you through the straightforward steps to design a compelling graphical abstract tailored for the Gastroenterology Journal. Whether you’re a seasoned researcher or a novice, these steps will help you distill your research into a visually engaging summary that highlights the essence of your study and enhances its visibility in the scientific community. Ready to create an impactful graphical abstract? Try Mind the Graph now.
What are Graphical Abstracts?
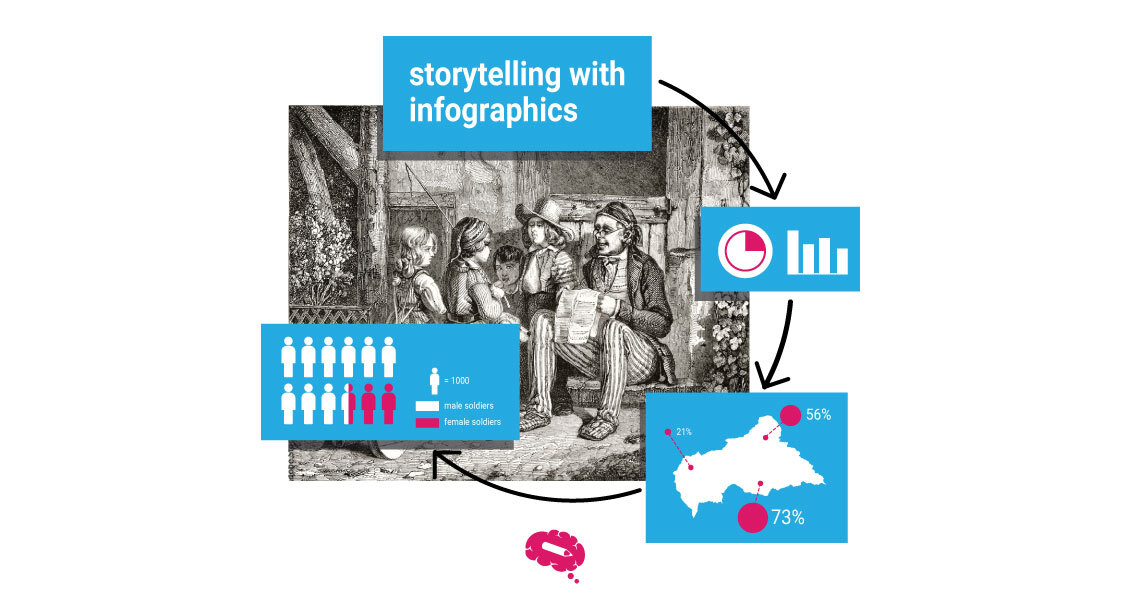
Graphical abstracts are visual representations that succinctly summarize the main findings of a research paper. They are a snapshot of the study, providing a clear and engaging overview that can quickly capture the interest of readers.
Purpose of a Graphical Abstract
A graphical abstract is designed to present the central focus of the research clearly and concisely. By using images, diagrams, and minimal text, it distills complex information into its most essential elements. This clarity helps readers immediately understand the primary objectives and outcomes of the study without having to sift through dense paragraphs of text.
Beyond just clarity, a graphical abstract should be engaging. It should draw the reader in and make them curious about the details of the study. This is achieved through well-designed visuals highlighting the key findings and their significance. An effective graphical abstract uses color, layout, and imagery strategically to make the information not only accessible but also interesting.

Advantages Over Traditional Abstracts
One of the main advantages of graphical abstracts over traditional text-based abstracts is their visual impact. Humans are naturally drawn to visuals, and a well-crafted graphical abstract can make a strong first impression. This visual appeal can be particularly beneficial in crowded research fields, where standing out is crucial.
A well-designed graphical abstract can capture the reader’s attention, making your research more memorable and prompting deeper exploration. Ready to make your research stand out? Create your graphical abstract now.
Graphical abstracts simplify the process of understanding complex research findings. They break down intricate data and concepts into digestible visual elements, making it easier for readers from diverse backgrounds to grasp the main points quickly.
This is particularly important in fields like gastroenterology, where the audience might include not only researchers and clinicians but also students and policymakers. A graphical abstract connects complex scientific language with broader comprehension, making the research more accessible.
In summary, graphical abstracts are powerful tools that enhance the visibility and impact of your research. Get started today.
Designing Your Graphical Abstract
Creating a compelling graphical abstract for a gastroenterology journal involves thoughtful planning and the use of appropriate tools. This guide will help you through the process of how to create a graphical abstract, from conceptualizing the design to selecting the right software.
Conceptualizing the Design
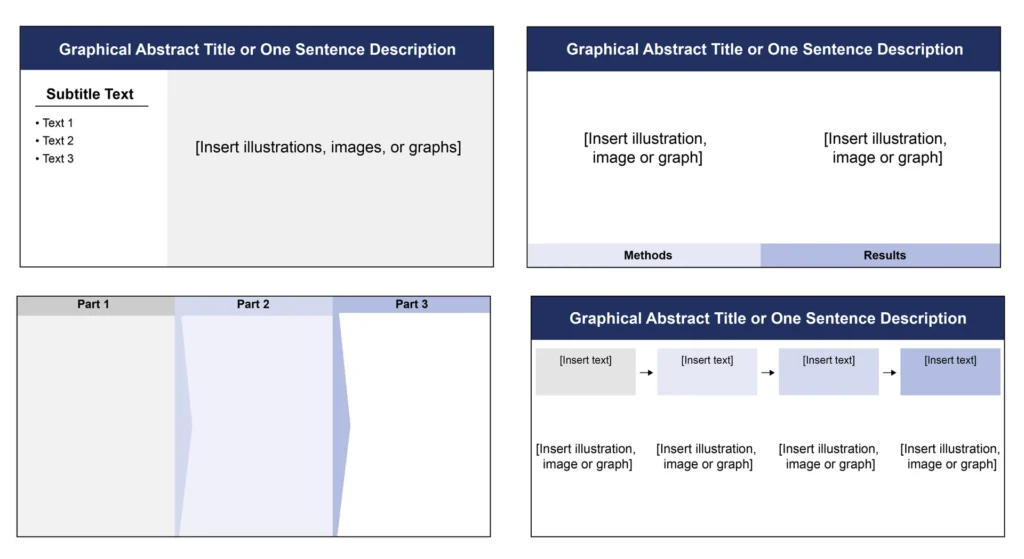
The foundation of a successful graphical abstract is a clear and concise core message. Start by identifying primary findings or the most significant insights from your research. Your core message should be easily understandable and directly related to the main purpose of your study. This focus helps ensure that your graphical abstract communicates the essence of your research effectively. Once you have your core message, determine the key elements that will visually support it. These elements can include:
Major Findings: Highlight the most important results of your study.
Data Visualizations: Use charts, graphs, and tables to present critical data points.
Illustrative Images: Incorporate images or diagrams that represent essential aspects of your research.
Brief Text: Include short, descriptive text to provide context and explanations where necessary.
These elements should be arranged in a way that is visually appealing and logically coherent, guiding the viewer through the main points of your study without overwhelming them with information.
Tools and Software
Designing a graphical abstract involves utilizing various tools and software that simplify the process and enhance the quality of the final product. Here’s an overview of the types of tools and software available for this purpose:
Mind the Graph: This tool is specifically designed for scientific research and offers a variety of templates and design elements tailored for creating graphical abstracts. It’s easy to use and requires no advanced design skills. Ready to create your graphical abstract effortlessly? Try Mind the Graph now.
Canva: Known for its simplicity, Canva provides customizable templates and a wide array of design elements. It’s excellent for beginners who need to create visually appealing graphics quickly.
Piktochart: This tool is ideal for creating infographics and graphical abstracts, with a drag-and-drop interface and numerous templates that make the design process straightforward.
If you have more experience with graphic design, consider these advanced tools:
Adobe Illustrator: A professional vector graphics editor that offers extensive design capabilities. It’s ideal for creating detailed and customized graphical abstracts but has a steeper learning curve.
CorelDRAW: Another powerful vector graphics editor, CorelDRAW provides robust design tools suitable for creating high-quality graphical abstracts.
Inkscape: A free and open-source vector graphics editor that offers many advanced features similar to Adobe Illustrator, making it a good option for experienced users looking for a cost-effective solution.
Crafting the Content
Creating a compelling graphical abstract requires careful attention to both visual elements and textual information. Here’s how to effectively craft the content of your graphical abstract.
Visual Elements
Selecting the right images and icons is crucial for conveying your message clearly and effectively. Ensure that every visual directly relates to the key points of your research to avoid distracting or confusing the viewer.
Choose simple, clear images and icons that are easy to understand at a glance, and use high-resolution, professionally designed visuals to maintain a polished appearance. Consistency is also key, so maintain a uniform style, color scheme, line thickness, and design throughout the graphical abstract.
Color plays a significant role in making your graphical abstract visually appealing and easy to understand. Use contrasting colors to highlight important information and make key elements stand out while considering the psychological effects of colors (e.g., blue for trust, red for importance).
Stick to a limited color palette to maintain visual harmony and ensure accessibility for all viewers, including those with color vision deficiencies, by using colorblind-friendly palettes and adding text labels where necessary.
Textual Information
A successful graphical abstract strikes a balance between visual elements and textual information. To achieve this balance, use concise text that provides enough context to understand the visuals without overwhelming them.
Position text strategically near relevant visual elements to help viewers easily associate the text with corresponding images or data points. Create a hierarchy of information using different font sizes and styles, with the most critical points in larger, bolder text and secondary information smaller and less prominent.
Use plain language that can be understood by a broad audience, avoiding jargon that may confuse those who are not experts in your field. Write in an active voice to make the text more engaging and dynamic, and break down complex information into short, manageable sentences for easier reading and comprehension. Utilize bullet points to list key findings or steps, making the text easier to scan and emphasizing important points.
Finalizing Your Graphical Abstract
After designing and crafting the content of your graphical abstract, it’s important to finalize it with precision and accuracy. Here are the key steps to ensure your graphical abstract is polished and professional.
Ensuring Accuracy
Accuracy is crucial in scientific communication, especially when crafting a graphical abstract that faithfully represents your research findings. If you’re learning how to create a graphical abstract for a gastroenterology journal, begin by verifying all data presented in the graphical abstract, ensuring charts, graphs, and numerical data accurately reflect your study’s outcomes. Properly cite and represent any references to previous studies or external data to maintain credibility and coherence.
Consistency is key; compare your graphical abstract with the full research paper to confirm that all data points and findings align seamlessly. Any discrepancies could undermine the integrity of your work. Harmonize the core message and key findings between your graphical and written abstracts by using consistent terminology and phrasing to avoid confusion.
Maintain a delicate balance between visual elements and textual information to ensure they complement rather than contradict each other. Visual elements should enhance the clarity and accuracy of the textual content, providing a cohesive and precise summary of your research findings within the graphical abstract.
Ready to create a precise and compelling graphical abstract? Explore the tools and templates available at Mind the Graph.
Getting Feedback
Before finalizing your graphical abstract, seeking feedback from colleagues or mentors is invaluable. Peer review offers a fresh perspective, often identifying errors or inconsistencies that may have been overlooked. Peers can also assess the clarity and comprehensibility of your graphical abstract, ensuring it effectively communicates your research to a broader audience. They provide insights on whether the visual elements align with your main findings and if any crucial information is missing.
Upon receiving feedback, prioritize the most critical suggestions and address them promptly. This may involve refining visuals, clarifying text, or ensuring accurate data representation. Embrace an iterative process of revision and refinement, recognizing that perfecting a graphical abstract often requires multiple rounds of feedback and adjustments to achieve clarity, accuracy, and impact.
Submission Process
Submitting your graphical abstract to a journal involves several steps, from understanding the review process to addressing potential requests for revision. Here’s a detailed guide to help you navigate this crucial stage.
The Review Process
- Initial Submission: Once you have finalized your graphical abstract, the first step is to submit it along with your manuscript to the journal. Ensure that you follow the journal’s submission guidelines, which may include specific requirements for file formats, resolution, and dimensions.
- Editorial Review: After submission, your graphical abstract will undergo an editorial review. During this stage, the journal’s editors will evaluate the quality, relevance, and accuracy of both your manuscript and graphical abstract. They will check for compliance with the journal’s standards and may assess the visual clarity and effectiveness of the graphical abstract.
- Peer Review: Following the editorial review, your submission will be sent to peer reviewers who are experts in your field. The reviewers will assess the scientific merit of your research, the clarity of your presentation, and the accuracy of your graphical abstract. They will provide detailed feedback and recommend whether your submission should be accepted, revised, or rejected.
Potential Requests for Revision
It’s common for reviewers to provide feedback, often requesting revisions that can significantly improve your graphical abstract and manuscript. Typical requests may include clarifications on specific points or suggestions to enhance understanding by adding additional details.
Reviewers may also highlight inaccuracies in data representation, prompting corrections to ensure the graphical abstract accurately reflects your research findings. Furthermore, they may recommend visual improvements such as adjusting the layout, enhancing color contrast, or incorporating more explanatory text to enhance the overall clarity and comprehension of the graphical abstract. Integrating this feedback effectively is essential for refining your work and increasing its impact.
Implementing Revisions
Addressing revision requests effectively is crucial for the successful resubmission of your graphical abstract. Begin by thoroughly reviewing the feedback and creating a checklist to ensure all points raised by the reviewers are addressed. Provide detailed responses to each comment, explaining how you have addressed the issues or providing a rationale if certain changes were not made.
Implement the necessary revisions to both the graphical abstract and manuscript, clearly highlighting all changes for the reviewers to review. Upon completion, resubmit your revised graphical abstract and manuscript to the journal, including a cover letter that summarizes the modifications made and acknowledges the reviewers’ feedback.
Discover the Power of Captivating Graphical Abstracts with Mind the Graph
Mind the Graph empowers scientists to create professional-quality graphical abstracts with ease through its user-friendly interface, extensive library of scientific illustrations, and robust customization options. The platform enhances communication by transforming complex data into clear, visually appealing summaries, thereby increasing understanding and engagement from a broader audience. Additionally, it streamlines the design process, saving valuable time and supporting collaboration among research teams. By using Mind the Graph, scientists can make their research more memorable and encourage further exploration. Start right now!

Subscribe to our newsletter
Exclusive high quality content about effective visual
communication in science.