
In the complex world of statistics, understanding the relationship between two variables is of utmost importance. If you are an analyst who is into statistics, you know how hard it is to understand such relationships. To make that easily understandable, this article is going to explore a certain method, Kendall’s Tau, a non-parametric measure that sheds light on the association’s strength and direction.
We aim to explain its complexities, applications, and significance, offering you a thorough comprehension of how it contrasts with other correlation coefficients and its varied applications across numerous fields.
Definition Of Kendall’s Tau
Kendall’s Tau is a statistical measure designed to determine the strength and direction of the association between two variables. At its core, it quantifies the degree of correlation through the comparison of relative rankings within data pairs.
To put it simply, imagine you have two lists of your favorite movies ranked from best to worst. Kendall’s Tau helps you see how similar your ranking is to a friend’s. It does this by looking at each pair of movies and checking if both of you agree on which one is better or not.
The score it gives at the end tells you how much your tastes match. A score close to 1 means you almost totally agree, a score around 0 means your tastes don’t match much, and a score close to -1 means you usually disagree.
What’s amazing about Kendall’s Tau is that it doesn’t need things to be measured in numbers or perfectly lined up; it just needs the order you put them in.
Related article: What Are Statistics Parametric Tests And Where To Apply Them?
So, it’s a great way to compare rankings in a simple and effective way, whether you’re looking at movie preferences, sports team rankings, or any other list where you want to see how two sets of rankings compare. This makes Kendall’s Tau a favored tool for statisticians and researchers delving into the dynamics of non-linear relationships across diverse fields.
Mathematical Formulation Of Kendall’s Tau
The mathematical formulation of Kendall’s Tau revolves around a simple yet insightful concept: it measures the relationship between two variables by comparing the ranks within their data sets.
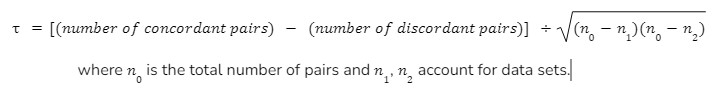
At its heart, the formula looks at every possible pair of data points and categorizes them as either concordant (both elements of the pair are in the same order in both data sets) or discordant (the elements are in opposite orders).
The formula then calculates the difference between the proportion of concordant pairs and discordant pairs, normalized by the total number of pairs. This calculation yields a coefficient that ranges from -1 (indicating a perfect inverse relationship, where higher ranks in one set correspond to lower ranks in the other) to +1 (indicating a perfect direct relationship, where higher ranks in one set always correspond to higher ranks in the other).
A score of 0 suggests no correlation. This approach allows Kendall’s Tau to give a nuanced view of how two sets of rankings relate to each other as we saw in the last section, without requiring any assumptions about the distribution of the data, making it a robust and versatile tool for statistical analysis.
Mathematically, Kendall’s Tau is calculated as:
Background And Use Cases
History
The history of Kendall’s Tau traces back to its starting point which was formulated by Maurice Kendall in 1938, and that proved to be the emerging point of a pivotal tool in the world of nonparametric statistics, designed to assess the correlation between two sets of data based on their ranks rather than their numerical value.
Use Cases
This innovative approach found its utility in a wide range of applications. For example, you can see it being extensively used in the financial sector, where analysts employ Kendall’s Tau to decipher the relationship between different investment assets, aiding in portfolio management by identifying assets that move together or inversely.
You can also see it being used in the environmental sector as well, researchers utilize it to understand the association between various ecological factors, such as the relationship between plant species and environmental gradients.
Understanding Of Kendall’s Tau
In order to understand Kendall’s Tau, you have to grasp its unique approach to measuring the relationship between two variables through their rankings. Unlike other correlation coefficients that require numerical values and often assume a linear relationship, Kendall’s Tau focuses on the order of data points, assessing whether pairs of rankings are in agreement (concordant) or disagreement (discordant).
Kendall’s Tau stands out for its simplicity and robustness, especially useful in situations where data do not meet normal distribution requirements or when dealing with ordinal data.
It is particularly valued for its non-parametric nature, making it less sensitive to outliers or non-linear relationships, thereby offering a clearer insight into the true nature of the relationship between variables.
This makes Kendall’s Tau a powerful tool in statistical analysis, capable of providing meaningful insights into the dynamics of various phenomena across a wide range of disciplines.
Applications Of Kendall’s Tau
Let us now see the applications of Kendall’s Tau. They are vast and varied, stretching across numerous fields where understanding the strength and direction of relationships between variables is crucial.
- In the world of statistics, it serves as a fundamental tool for hypothesis testing, especially in situations dealing with ordinal data or non-normal distributions, making it indispensable for researchers conducting non-parametric analyses.
- In the social sciences, Kendall’s Tau is frequently employed to analyze survey data, helping to uncover underlying patterns in social preferences and behaviors by assessing the correlation between different response variables.
- The health sciences benefit from its application in epidemiological studies, where understanding the correlation between risk factors and health outcomes can inform public health strategies and interventions.
This wide-ranging applicability makes Kendall’s Tau’s versatility as a statistical measure, capable of providing valuable insights into the dynamics of complex relationships in many contexts.
Limitations And Advantages Of Kendall’s Tau
While highly versatile and robust, Kendall’s Tau is accompanied by distinct advantages and certain limitations that require careful consideration.
A major advantage of Kendall’s Tau is its non-parametric nature, allowing it to effectively analyze ordinal data and relationships without assuming a normal distribution, making it particularly valuable for small sample sizes or datasets with outliers. This attribute enhances its applicability across various disciplines, offering a reliable measure of association even in non-linear contexts. Furthermore, its simplicity and interpretability facilitate a straightforward understanding of the correlation between variables.
On the other hand, the limitations of Kendall’s Tau include its potential computational intensity with large datasets, as the pairwise comparison approach can become resource-intensive. Additionally, while its non-parametric nature is an asset, it may also limit the depth of insights into the nature of the relationship between variables, especially in cases where a parametric approach could offer a more nuanced understanding.
Despite these limitations, the balance of ease of use, robustness, and applicability positions Kendall’s Tau as a valuable tool in the statistical analysis arsenal, adept at navigating the complexities of ranking-based data analysis.
Conclusion
In conclusion, Kendall’s Tau offers a nuanced perspective on the association between variables, breaking the limitations set by the traditional correlation coefficients. Its adaptability across various fields emphasizes its importance in statistical analysis, providing researchers with a robust tool to decipher complex relationships. This article aimed to explain the intricacies of Kendall’s Tau, fostering a deeper understanding and appreciation of its capabilities and applications.
Over 75,000 Accurate Scientific Figures To Boost Your Impact
Have you ever wondered how some researchers and scientists make impactful posters and presentations using visuals even though they have limited knowledge of creating infographics? That’s possible by leveraging technology via tools like Mind the Graph.
Mind the Graph is a tool that has over 75,000 accurate scientific figures to boost your impact. And the best part is, it’s especially designed with the help of scientists and can be curated based on your needs. Check out the library of visuals by signing up to Mind the Graph and ace your research journey with utmost ease.


Subscribe to our newsletter
Exclusive high quality content about effective visual
communication in science.