这个教程视频告诉你如何在Mind the Graph上创建一个信息图。该 信息图表模板 给我们的用户,所以他们不需要从一张空白的画布开始。是节省时间和创造醒目的最好方法。
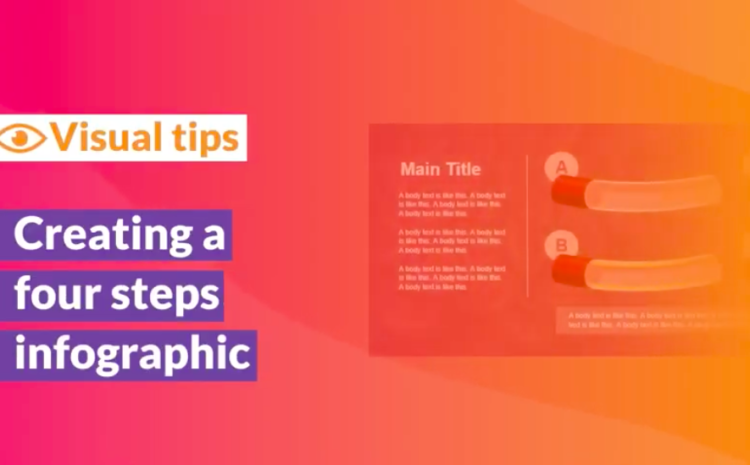
在下面的教程视频中学习如何在Mind the Graph中创建一个信息图。本周的主题是 "四步 "信息图。
关于如何用科学插图创建一个有吸引力的信息图的教程视频 Mind the Graph我们为科学家和学术界提供信息图表制作工具。我们把科学家变成设计师,以提高他们的工作效率。 影响!
- 如果你喜欢这个视频,请访问 Mind the Graph Youtube频道 为每周更新的
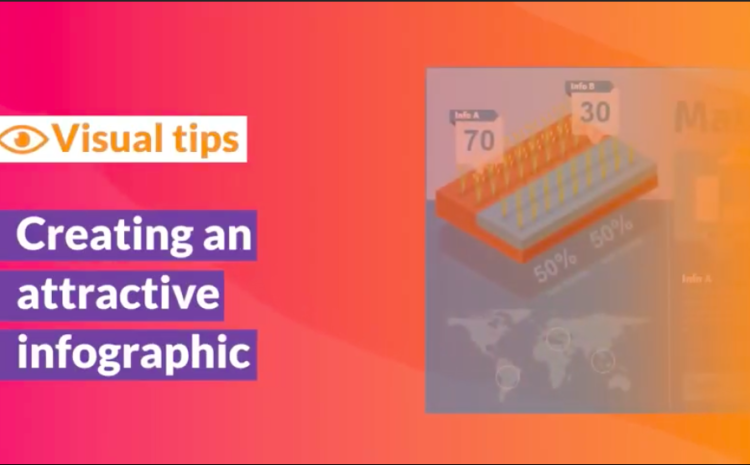
- - "视觉提示 "播放列表中的教程信息图视频。
- - 关于如何使用Mind the Graph功能的教程视频的 "如何 "播放列表
正如你在我们的教程视频中看到的那样,使用信息图表制作器非常简单。
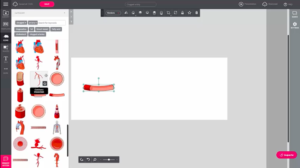
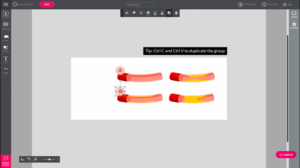
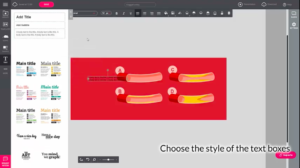
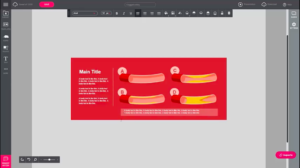
选择 最好的插图 从你的领域,改变颜色和背景,创建一个独特而美丽的信息图。该教程视频有视觉提示,帮助你使用颜色、插图和图表,把你的数据变成视觉效果,讲述一个清晰的故事。
如果你是订阅者,只需 前往我们的画廊 并选择最适合你的模板,点击它,开始创建你的信息图。你也可以在你的工作区里选择一个模板。这样你就可以尝试不同的风格并选择你喜欢的。如果你不是订阅者,你可以使用这些模板作为你创作的灵感,或者投资几美元。 来访问所有的图表功能。
Mind the Graph是一个创建科学信息图、演示文稿和图形摘要的在线平台。学习如何在你的图形摘要中使用不同的插图。
要看到更多美丽的模板。 https://mindthegraph.com/templates/
要开始免费使用Mind the Graph。 https://mindthegraph.com/
要学习如何制作信息图。 https://goo.gl/MYBmRd.
相关文章


订阅我们的通讯
关于有效视觉的独家高质量内容
科学中的交流。
- 独家指南
- 设计提示
- 科学新闻和趋势
- 教程和模板