
Visual abstracts are the best way to represent scientific information. They help to communicate complex scientific principles for a common (non-scientific) reader. However, it remains a question: where do you find a good Visual Abstract Template? Well, Mind the graph is here with all the template solutions that you need.
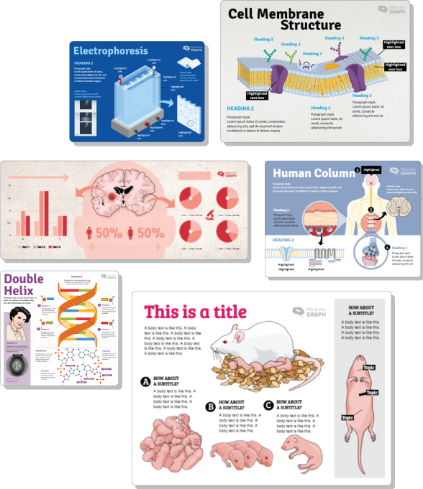
Mind the Graph has developed a pool of visual abstract templates for various categories to help you prepare the best graphics in the scientific community. Let us go through the steps together and prepare your graphics using the Mind The Graph visual abstract template.
Elements Of A Visual Abstract Template
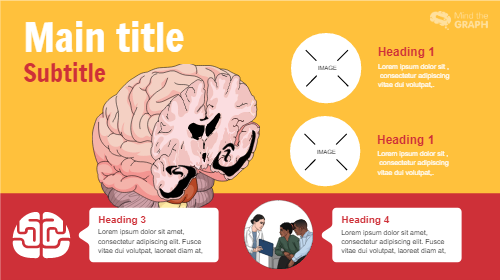
Title
Describe the title of your study as the main title. A title should be as clear as possible. Mind the Graph template also gives you the possibility of adding additional text as subtitles. If the template does not show the option it can also be added from the side toolbar “Add Text” A subtitle should provide a brief contest of the study to the reader.
Purpose
While you arrange various visual elements, make sure that the purpose of the study is clear in the text. While we tend to describe the method, result and observation in various heading (1-4) sections, do not miss the purpose of the abstract.
Key Points
Essential ideas or findings can be covered under various heading sections. Use concise bullet points highlighting the core message.
Visual Elements
Visual abstract templates from Mind the Graph allows you to access the enormous database of icons and illustrations specifically prepared for the scientific community. Use of images, icons, or graphics to represent key information. We also have a molecular library for the addition of chemical structures.
Attractive color schemes that align with the content can be used to emphasize the research. With great background options change the color and its transparency to suit your style of the graphics and icons.
Consider Using Fonts With A Good Readability
The selection of fonts for a visual abstract is also very important. The template gives you the best-selected font style according to the designer. However, it is always possible to choose something that you use as your research group identifier or your conference, or university requirement. Some journals also could provide you with specifications for visual graphics.
Do you want to create a visual blog post for social media, please read our article here. Read more about the design elements and their selection here.
In case your research needs to be presented with charts or graphs, you can upload and insert them as an image. There is an option for creating simple graphs on the toolbar too.
Stepwise Guideline For Using Mind the Graph Visual Abstract Template
Step 1: Create your account with Mind the Graph at Mind the Graph website.
Step 2: Select “Infographics Template” from the menu bar.
Step 3: Select the type of visual graphics you want to make from the wide variety of the selections provided by our designers: visual abstracts/graphical abstracts, posters, infographics, and more.
Step 4: Choose your template and a new window will open up. With user-friendly working tools, customize the title, color, icons, and text in the template.
Step 5: Sit back, relax and get going! Within the next few minutes, you would be ready with an excellent representation of your research as a visual abstract.
Didn’t Find The Illustration You Need? We’ll Design It For You!
With the “request an illustration” button at the end of the side toolbar, you can request a specific illustration for your visual abstract template. As we did for a lot of researchers, we can prepare customized solutions for you to make sure your presentation is tailor-made. Connect with us and discuss your needs. Our team will reach out to you as soon as they can!
Become part of the Mind the Graph community and access the world of scientific graphics with us! Get on board and minimize your time being spent on visual abstract preparation.


Subscribe to our newsletter
Exclusive high quality content about effective visual
communication in science.