3 min läsning
07/29/2022
Den vetenskapliga bloggen Mind The Graph är tänkt att hjälpa forskare att lära sig hur man kommunicerar vetenskap på ett okomplicerat sätt.
Den här artikeln handlar om vad peer-reviewed artiklar är och varför det anses nödvändigt för att säkerställa akademisk vetenskaplig kvalitet
Ta reda på vilken typ av slutsats som passar bäst för din forskning, hur du skriver den steg för steg och vilka vanliga misstag du bör undvika.
Lär dig mer om de anatomiska positionerna och varför de är så viktiga för varje organism inom medicinen.
Upptäck de många formerna av plagiering, de bästa sätten att förhindra det och hur du avgör om ditt arbete innehåller det av misstag.
Förstå vad post hoc-analys är och hur man hittar värdefulla data och mönster efter att studien har slutförts.
Lär dig hur du sammanfattar dina artiklar på ett effektivt sätt med hjälp av dessa enkla tekniker och branschens bästa praxis.
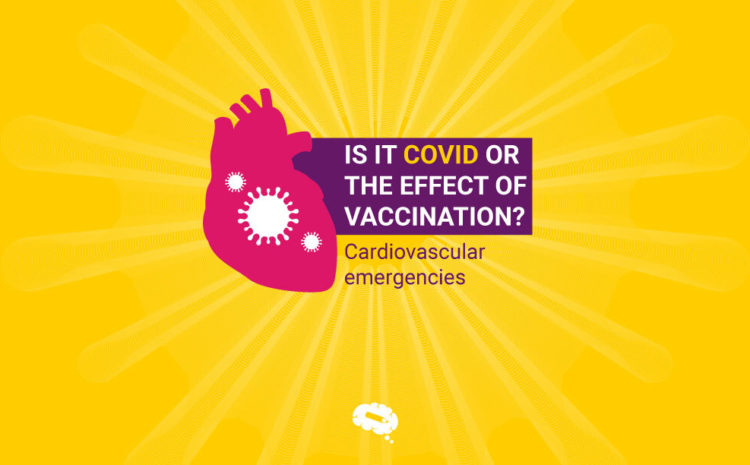
Den aktuella artikeln handlar om olika hjärtkomplikationer som orsakas av covid-19 under infektionscykeln och dess långsiktiga effekter.
Förbättra din forskningsrapport och lär dig hur du tar fram en exakt och grundlig hypotes för din forskning.
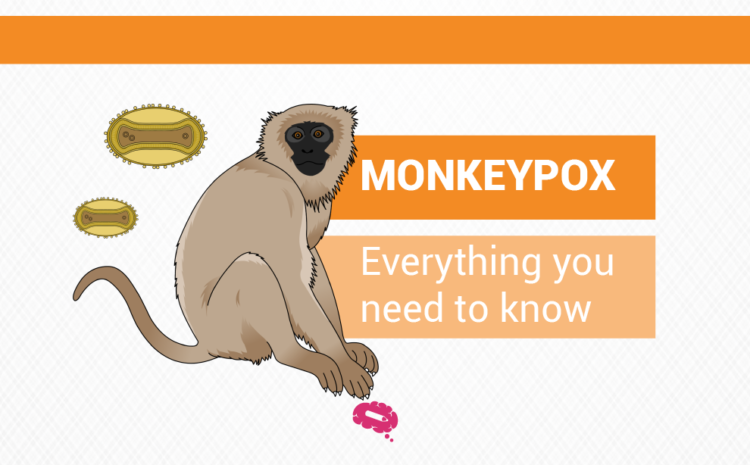
I den här artikeln tar vi en titt på vad monkeypox är och hur man identifierar dess symtom och rekommenderar åtgärder för att förebygga det.
Förstå hur man genomför en mer exakt och detaljerad konceptuell analys för att omvandla den till ett mer konkret koncept.
Den här artikeln förklarar hur du bäst kommunicerar information till din publik, inklusive siffror i en forskningsrapport.
Här är en guide som hjälper dig att skriva en bra problemformulering och förstå vikten av dess kvaliteter, element och ramverk.
Slides presenterar kärnan i innehållet på ett mycket fördelaktigt sätt om du utnyttjar beprövade tips för formatering.