Online marketing is constantly evolving. The strategies that are relevant today might not be relevant after a few years. But there’s one strategy that remains constant with every passing year – the power of visual content!
Here’s probably why – 90% of information transmitted to the human brain is visual. We, humans, are hardwired to process visual information 60,000 times faster than text!

Now you know why we all are always drawn towards attractive visual designs. While scrolling through the social media feed, we are urged to stop scrolling at the sight of an eye-catching visual.
Social media today is increasingly driven towards visual content. Facebook, Instagram, and now TikTok are thriving on visually-driven content.
What does all of this tell you? Visuals are the best type of content to get users’ attention.
We live in a world that is full of external stimulation. At any given point in time, there are so many things happening around us that our attention is constantly divided.
In fact, the average attention span of a human is 8 seconds1, which is less than a goldfish!
With so many distractions, it’s extremely difficult to catch the users’ attention just through plain text-based content. We need to go the extra mile. But, how? Through visual content!
If you think about it, most of the advertising campaigns, product promotions, and even informational top-of-the-funnel content are visual.
This is because, over the years, marketers have realized the importance of infographic and visual design trends. They have unleashed the true potential of visual trends and how it can be transformational for their business.
If you’re keen on knowing some of the top graphic design trends in 2021, then we’ve got you covered.
In this guide, you’ll find some unique and interesting infographic and visual design trends that will help you create some stunning visual content, captivate your audience, scale your engagement, and accelerate the growth of your business.
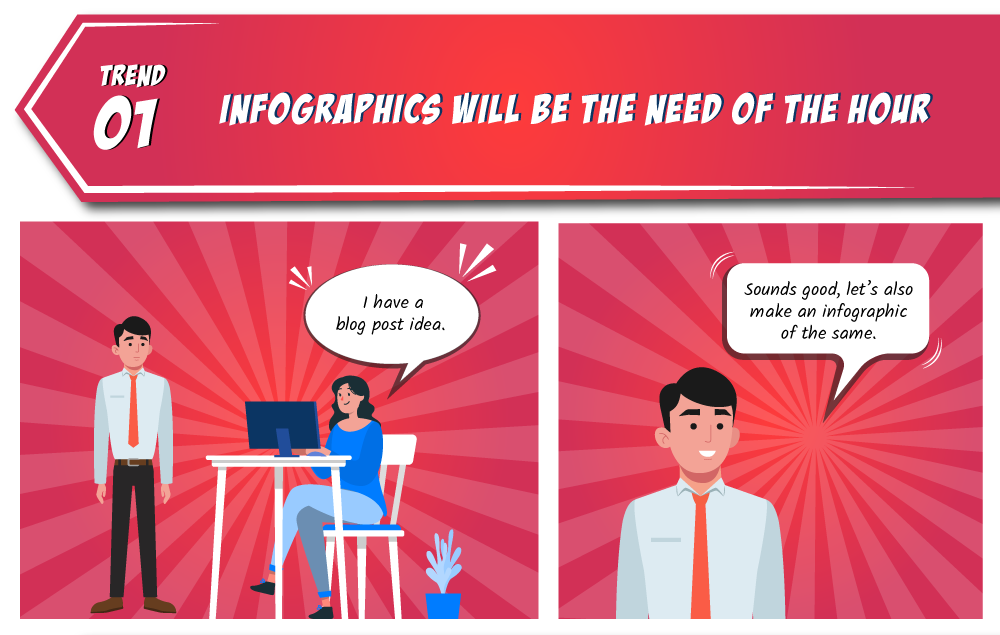
Trend 1: Infographics will be the need of the hour
One of the most prominent trends we observed was that infographics are everyone’s hot favorites now.
Infographics are essentially visuals that can help you deliver information in a visual, easy-to-understand format. This is exactly why they are so popular.
Infographics are value bombs with loads of information stored in a visually appealing graphic.
They work great because most of your audience is looking for useful, actionable information that can help them overcome their pain points.
While this information can be delivered with the help of text-based content, it is difficult to catch their attention with it.
Also, comprehending text-based content takes more effort. So, people usually tend to skip it.
But, in the case of infographics, the brain’s processing power comes into play. When your audience finds information that’s easy to digest and not overwhelming, they are bound to stop and take a look at it.
Here are a few stats that highlight the importance of infographics:
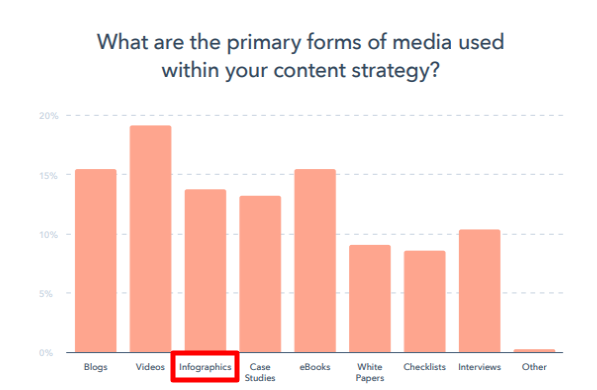
- Infographics are the 4th most used media in content marketing. (HubSpot2)
They are proving to be an effective format for marketers who want to share engaging and easily digestible content.
- 56 percent of marketers use visuals or infographics in almost every piece of content. They have surely realized that not everyone likes to read text-heavy blog posts.3
- The infographic trend is raving in the B2B segment too. 65 percent of B2B marketers have used infographics for content marketing.4
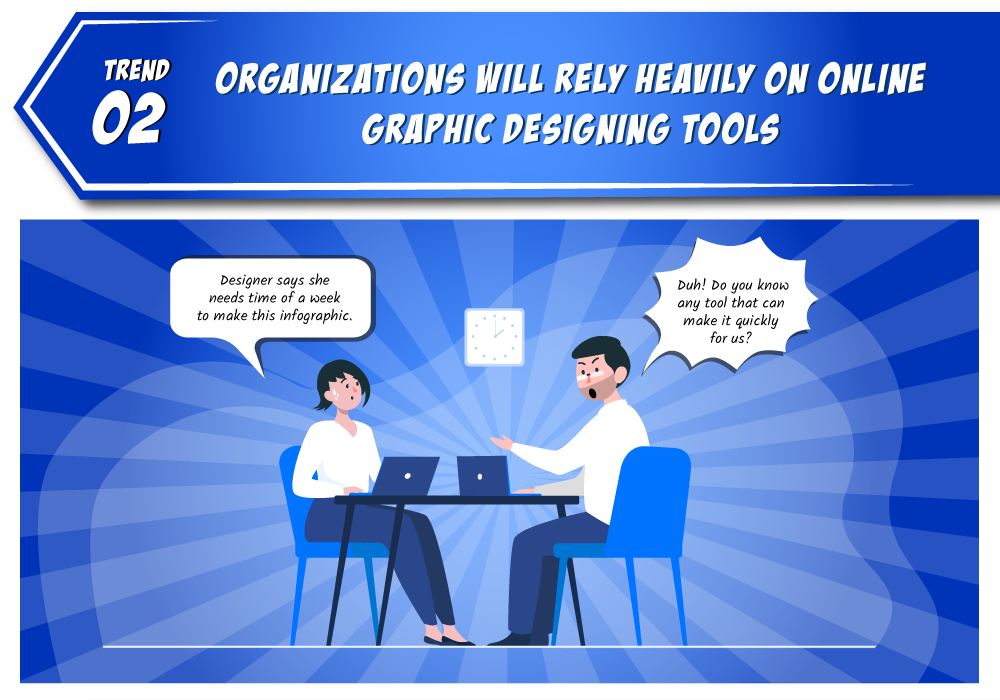
Trend 2: Organizations will rely heavily on online graphic designing tools
Gone are the days when businesses produced one infographic in a blue moon.
They had the luxury of hiring graphic designers and waiting for days to get the designs done.
Then the design would go through multiple rounds of edits – you know the drill!
But, what happens when we need to mass-produce visual content? 56 percent of marketers3 say that they use a visual or infographic in almost every piece of the published content.
Relying on a graphics designer for each of your visuals and waiting over it for days, only to find that the designs were not as you expected is not feasible anymore. This has especially been true after the whole lockdown situation.
43 percent of content marketers5 said producing consistent visual content like infographics is their biggest challenge.
Hence, most organizations are moving to online graphic design tools. The ease of use of these tools will amaze you. Plus, such tools are quite cost-effective when compared to hiring people for your designs.
The perks of using such tools are endless. You can customize your designs as per your requirements without having to rely on someone else.
Further, you can produce multiple designs in a row without having a huge dent in your pocket.
No wonder, 50 percent of marketers3 use an online graphic design tool to create their visual content.
Whether paid or free, these tools allow them to improve efficiency and put stunning creativity into real-world design.
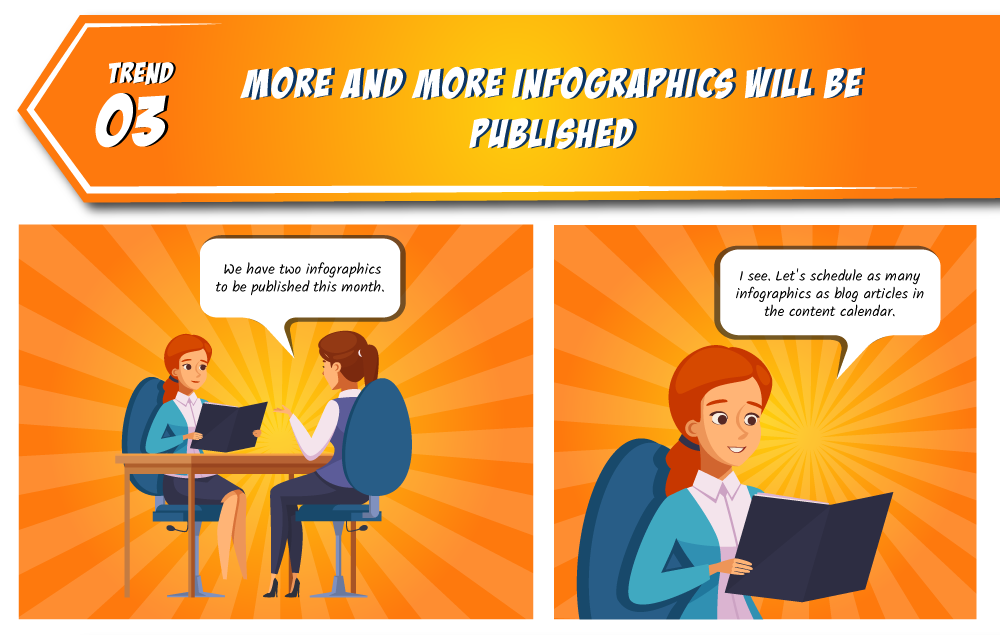
Trend 3: More and more infographics will be published
Today we see an increasing number of blogs are exploiting the power of infographics.
With the advent of various graphic design tools, producing tons of infographics each month has become a cakewalk for many businesses.
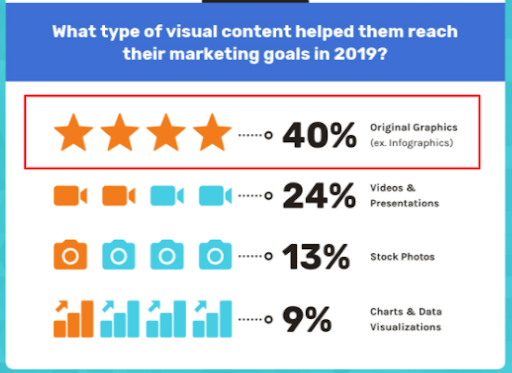
According to an infographic published in Social Media Today, 40 percent of marketers5 shared that infographics helped them achieve their marketing goals.
Besides improving brand awareness, infographics generate more backlinks for businesses.
Infographics generate 178 percent more backlinks6 than other forms of content. Hence, most businesses are drilling down on infographics as their main pieces of content. Infographics are linkable and shareable assets.
In fact, infographics are among the best types of content7 when it comes to attracting backlinks. 65 percent8 of people are visual learners and prefer simple and easy to follow as offered through infographics.
So, if you publish high-quality infographics on a trending or an evergreen topic, many websites will add links to it. This will be of great help for your websites’ SEO. Infographics also tend to get shared a lot on social media channels.
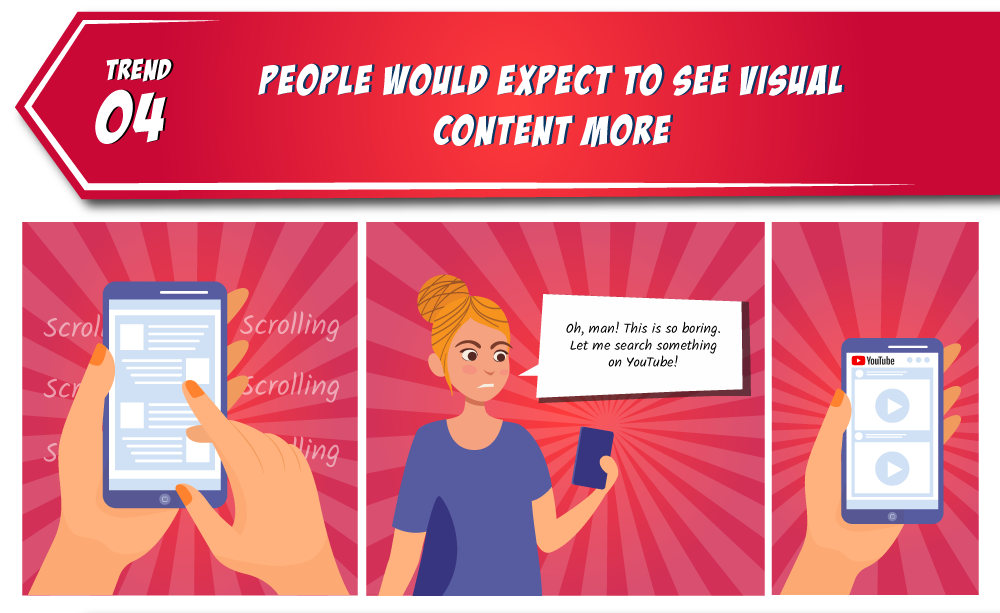
Trend 4: People will want to see more visual content
Businesses are creating more infographic content because users respond well and expect more visual content from them.
50% of the human brain9 is used for processing visual information. Also, data shared by Venngage10 reveals that colored visuals increase people’s desire to read content by 80 percent.
No wonder, posts with images produce 180 percent more engagement than those without visual content.
Long-form content is the rage now. But imagine having long-form content cluttered with text.
Users will not care to scroll through even 20 percent of the page. So, a long-form guide can get you first page rankings, but to convey the message, it should be delivered visually to make people act on it.
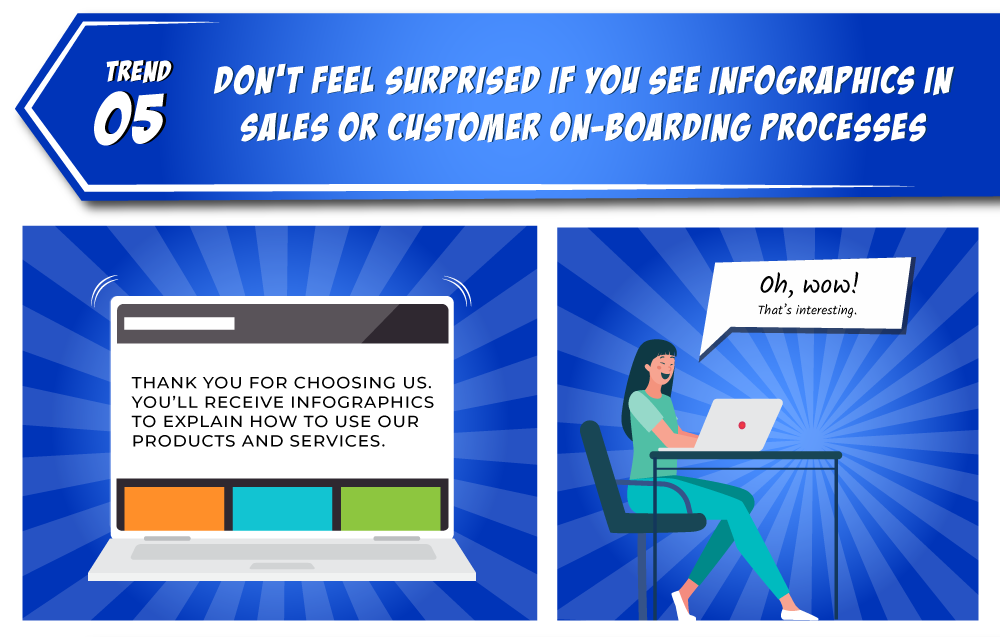
Trend 5: Infographics are paving their way through sales or customer on-boarding processes
If you think infographics only make great top-of-the-funnel content, think again! Infographics are useful for every stage of your marketing funnel.
Infographics deliver information in an easily digestible manner. So, it can surely be used for your sales and onboarding processes.
Right from product comparisons, customer success stories, to training materials for newly onboarded customers, infographics can be employed for it all!
Sounds unbelievable? Here are a few facts to support our claim that infographics can improve your sales and bottom line.
- Infographics and other colorful visuals can increase sales by up to 80 percent. So, by adding color to your content you can ensure that your customers understand your brand better, thus saving your company time and money. 11
- Consumers tend to focus on ‘information-carrying images’ like infographics more than they read the page’s text. In fact, visitors spend around 10 percent more time on visual content than plain text. 12
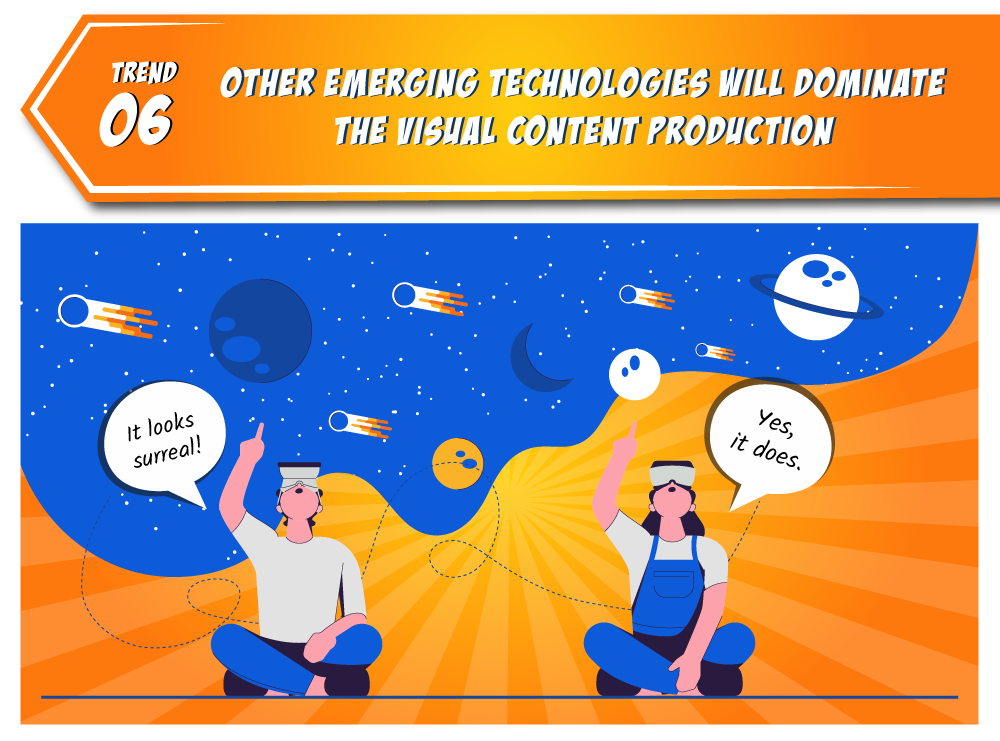
Trend 6: Other emerging technologies will dominate the visual content production
Another major visual trend that you’ll observe in 2021 is the rise of technologies that support new-age visual content.
Technologies such as Artificial Intelligence (AI), Machine Learning (ML), robots, Virtual Reality (VR), and Augmented Reality are being increasingly used to create visually-engaging content.
These technologies provide an immersive, super-engaging, and more real-life experience to users as they consume visual content.
The social media giant Facebook is getting VR13 to the forefront. They have announced the beta version of Facebook Spaces.
VR design creates a simulated environment where people can experience and immerse themselves through hardware like headsets.
Technologies like VR seem to be the tech disruptors in the visual content realm. No wonder, a quarter of VR users14 believe it has a strong potential for brands and marketers.
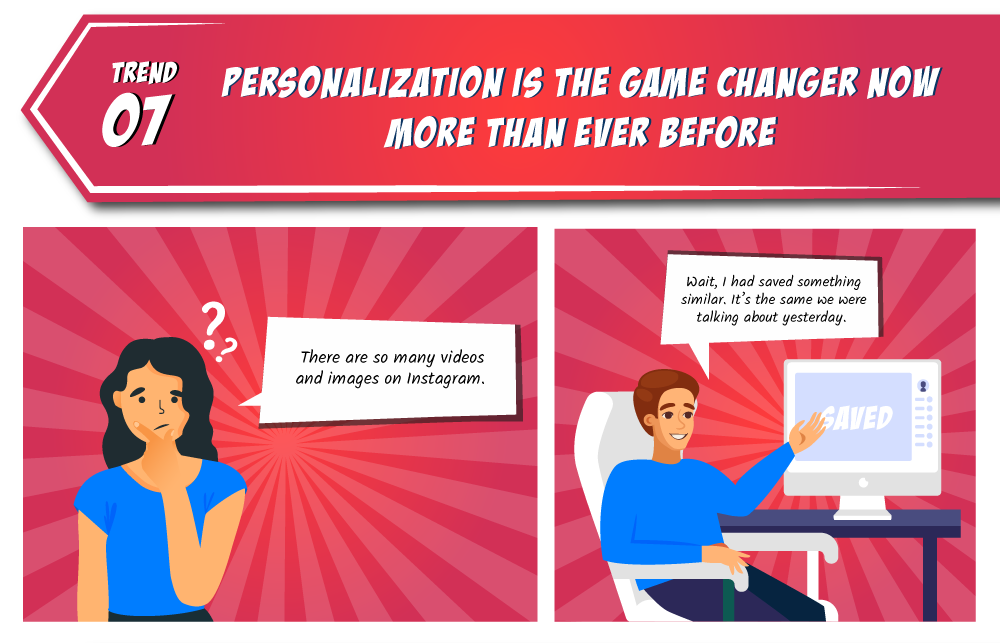
Trend 7: Personalization will be the game changer
Modern customers are not fooled by mass-produced generic content.
They feel valued when brands come up with tailored experiences. This goes a long way in gaining their trust and loyalty.
Therefore, it’s important to create visual content that resonates with your audience.
For instance, your Gen Z audience may prefer infographics and video-based content. On the other hand, the Baby Boomer generation would prefer classic approaches like banner ads.
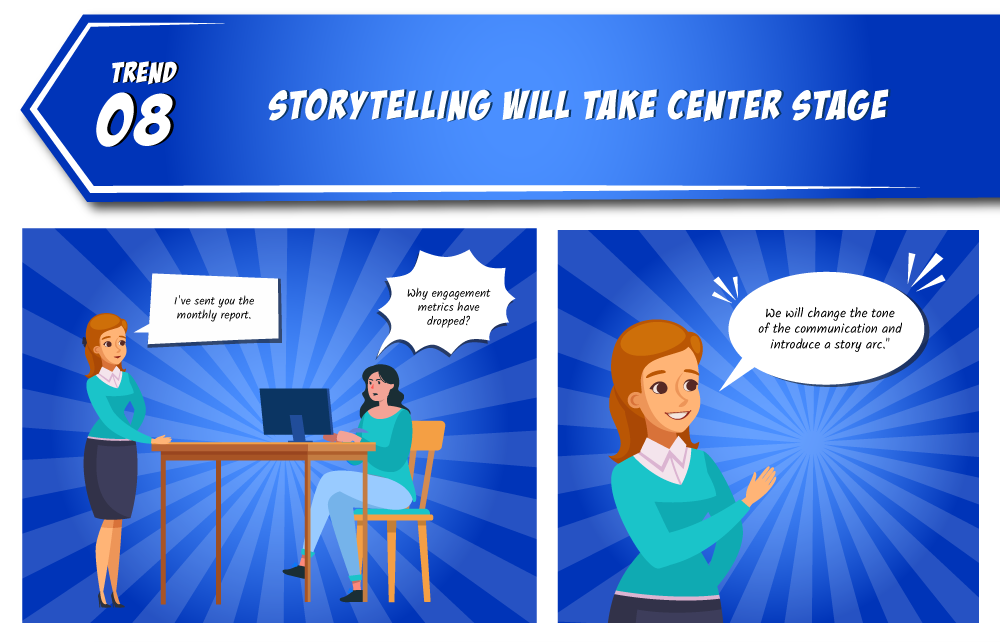
Trend 8: Storytelling will take center stage
Storytelling with visual content is a super-effective strategy that is widely used in content marketing.
Why?
Because people can connect better with stories. When brands use storytelling, they build empathy and compassion with the audience.
This helps in creating a deeper connection with the users, thus helping them stand out from hundreds of other visuals.
Your users should know why they would opt for a specific product or service.
Hence, marketers should address the WIIFM (what is in it for me?). Brand stories resonate with your brand voice and deliver what audiences can relate to.
For example, Airbnb practices brand storytelling through its video content.
They use a customer-centric storytelling strategy15 to engage and entertain their audience. You too can create visual storytelling content to captivate your audience and gain their trust and loyalty.

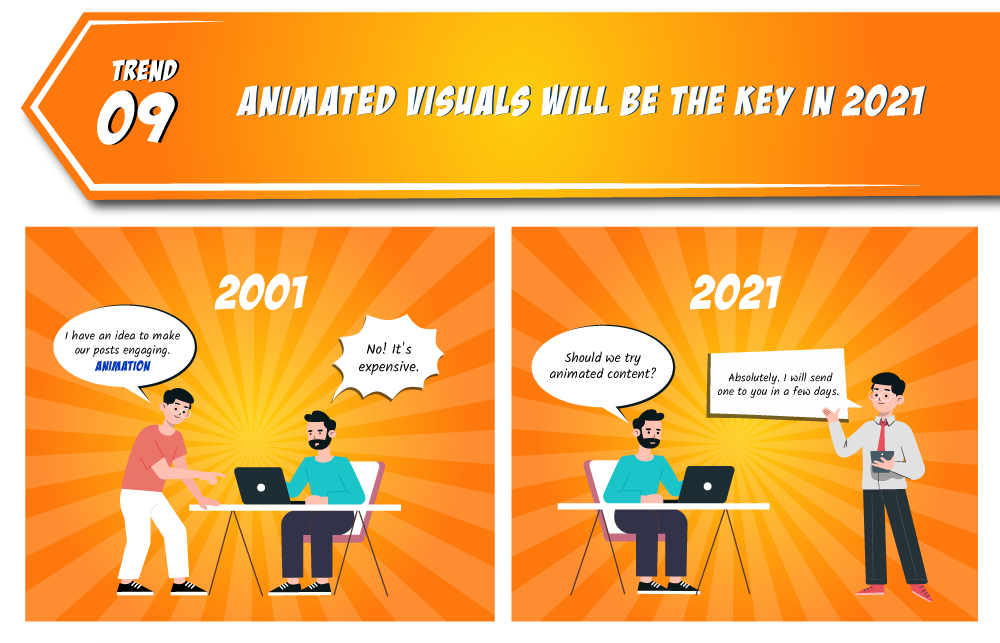
Trend 9: Animated visuals will be key in 2021
Animated visuals have been and will continue to be in trend for a long time. Visuals such as GIFs and videos can completely transform any piece of content.
This is especially true when your target audience consists of millennials and Gen Z. Right from explaining science concepts to creating memes, animation can be used to hook the audience and keep them engaged.
Hop on to this trend by focusing on animated videos that complement your brand voice and messaging. You may edit video on your own or you can also edit a series of images into GIFs or even use a preexisting one to amp up your content marketing game.
Trend 10: Infographics will serve multiple roles
Many businesses find it tough to incorporate infographics in their content style and target audience. But the fact is, infographics can serve multiple roles across various sectors.
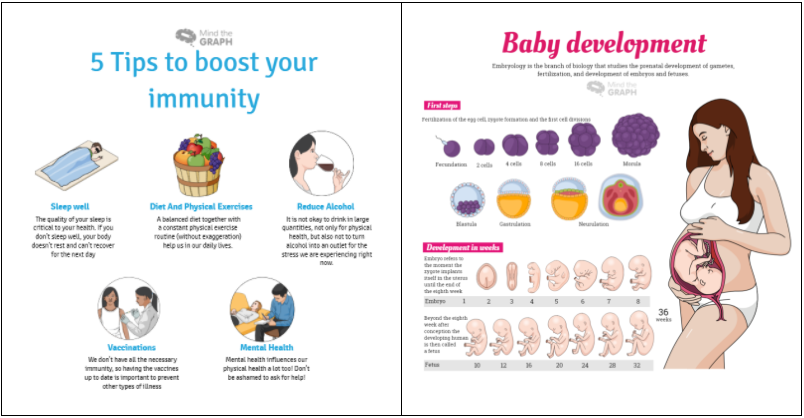
A good example of this would be the health and fitness niche.
Who thought that having infographics as a means of communicating information to patients would prove to be so useful.
284 percent more patients are likely to estimate risks16 and make decisions to improve their health when they receive health infographics.
Hence, many healthcare players are using infographics to educate their patients.
Not just health and fitness, infographics are being used in sectors that would have been difficult to imagine a few years back.
For instance, the environment, social justice, and manufacturing segments are using infographics to capture and convey their information to millions of people across the globe.
Infographics are also playing a multipurpose role across various B2B and B2C marketplaces. Hop on to the trend before it gets too late.

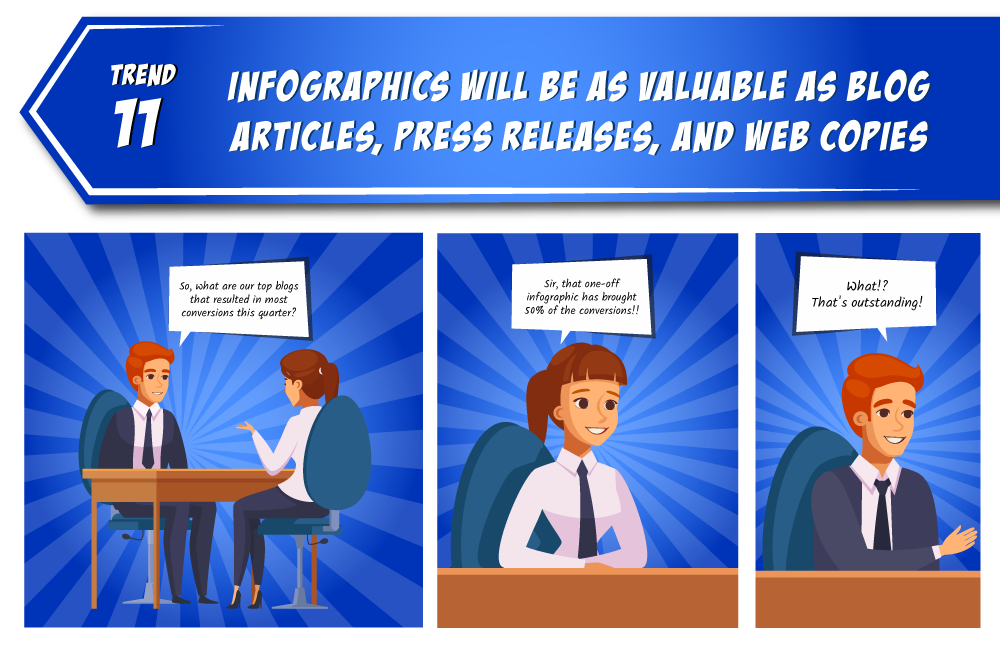
Trend 11: Infographics will be as valuable as blog articles, press releases, and web copy
People have long realized the impact of publishing quality content on their website traffic. Those who have been consistently sharing content in the form of blog articles, and press releases have seen great results.
The same trend is getting repeated with infographics. Infographics spark curiosity among people and are a linkable asset to businesses.
Sharing content in the form of an infographic can boost a site’s traffic by up to 12 percent17.
That’s because infographics tell data stories in an interesting manner and are 30 times more likely to be read18 than blog posts and news articles.
Moreover, people prefer reading content with visuals.
Jeff Bullas shares that posts with images receive 94 percent more views and reads than the ones without images. No wonder, high-quality infographics tend to generate backlinks from authoritative websites.
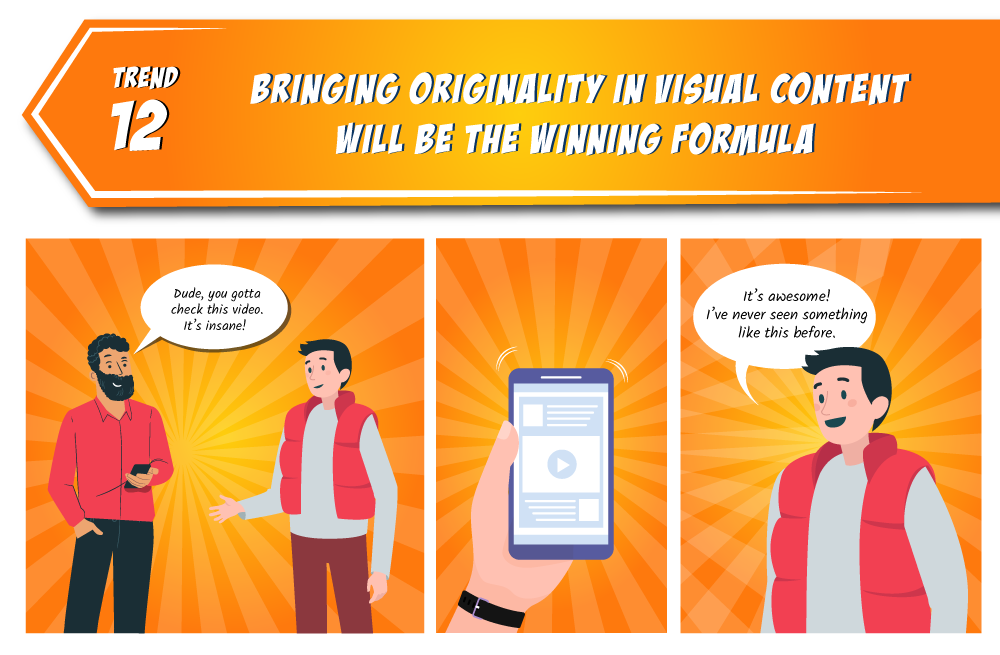
Trend 12: Bringing originality in visual content will be the winning formula
Everyone’s jumping on the ‘quality content’ and ‘keyword-targeted’ bandwagon. Hence, it’s pertinent that brands find innovative ways to outshine their competitors.
Producing original and value-adding content is key to capturing an audience’s attention.
Almost 50 percent of marketers19 agree that original visual content performs better than other forms of content on desktop and mobile.
In another survey, 40 percent of marketers3 believe that original graphics such as infographics and illustrations engage their audiences the best.
Hence, marketers need to find unique ways to build links and authority and strengthen their brand image.
Visual storytelling using formats like infographics, explainer videos, and whiteboard animations, for instance, can help in engaging an audience and achieving more conversions.
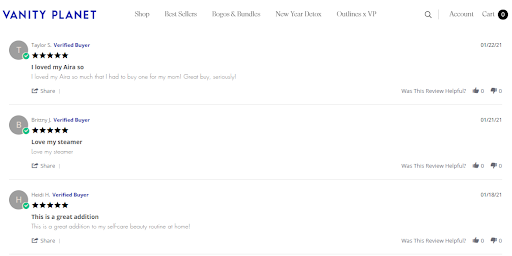
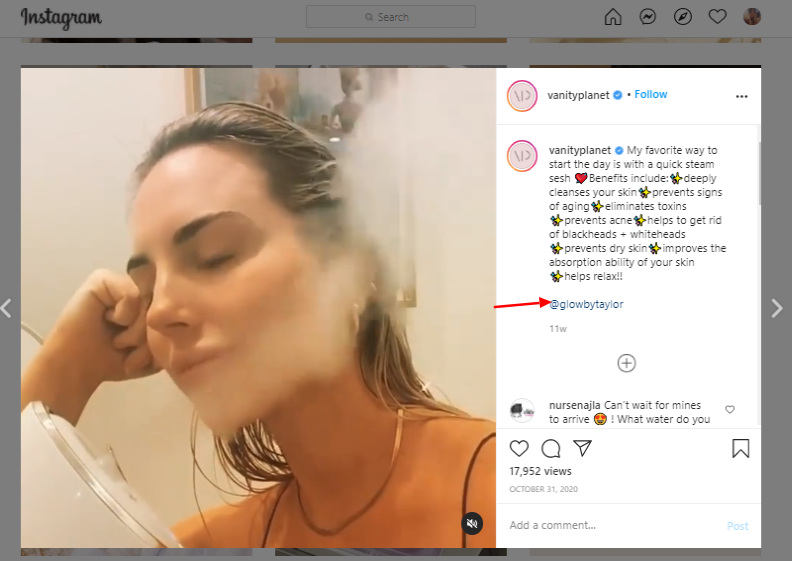
Similarly, user-generated content (UGC) can be a killer asset for businesses. A report by ClickZ20 reveals that more than half of the customers trust UGC over other forms of promotional content.
UGC offers some form of social proof from brands, urging them to make a decision in their favor.
According to data shared by Yopto21, UGC can boost conversion rates by as much as 200 percent.
Check out how Vanity Planet22, an online beauty store, experienced a 24 percent increase in conversions by displaying relatable UGC on its product pages and Instagram channel.
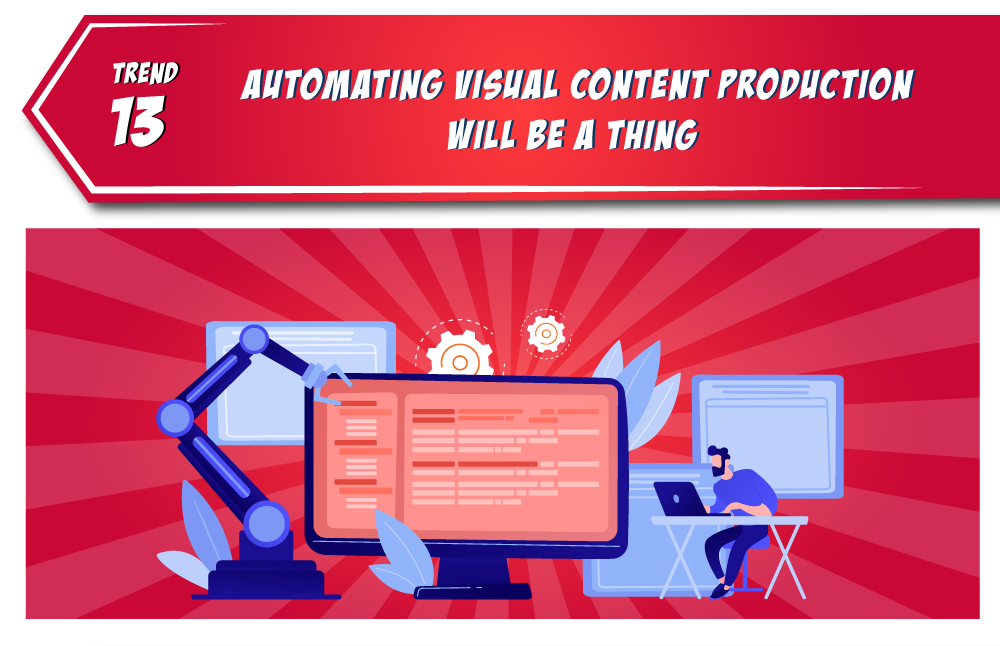
Trend 13: Automating visual content production will be a thing.
Automation has been the buzz word over the past decade. It has revolutionized several industries including the creative space.
The intense competition and increased need for engaging customers have made it critical for brands to produce creative content in bulk.
However, producing quality content consistently isn’t a cakewalk. 35 percent of marketers3 admit that producing consistent content is their biggest struggle when it comes to visual content.
Creative automation is the fitting answer to this. It can help marketers scale up their content generation efforts while saving time and retaining content quality.
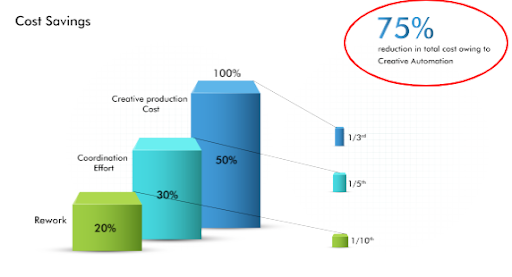
In fact, a study conducted by Rocketium23 revealed that businesses produce creatives 20 times faster with creative automation, translating into 94 percent less time spent on making creatives.
It also reduced the production cost by 75 percent.
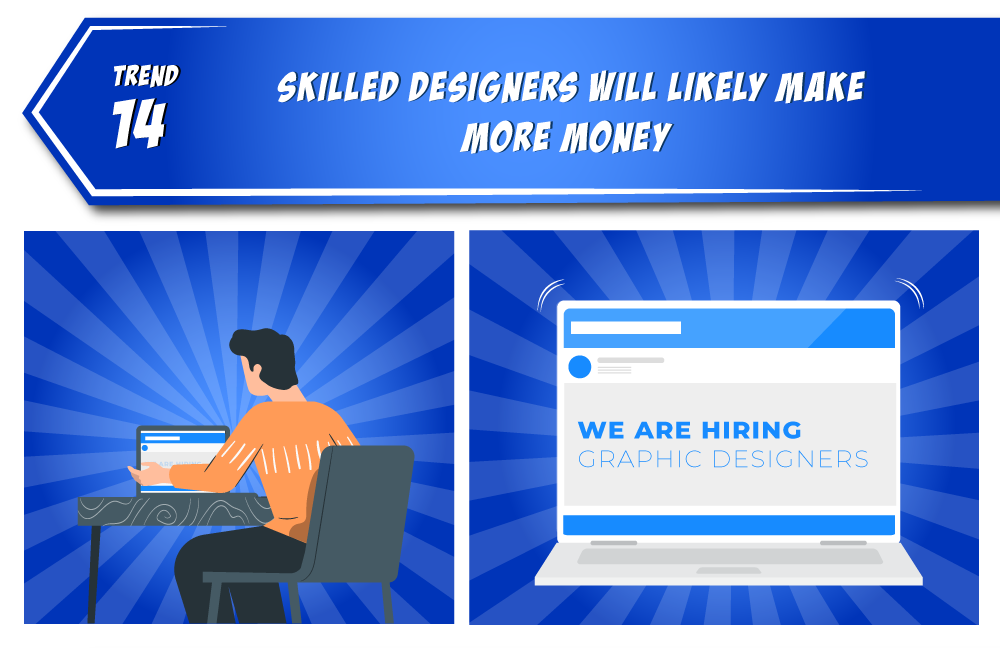
Trend 14: Skilled designers will likely make more money.
The visual design industry is constantly evolving with new technologies and trends. This means the design skill set sought by businesses is always in a flux. So, staying ahead of the game means acquiring or honing skills that are in demand.
56 percent of marketers3 say that they use a visual or infographic in almost every piece of the published content. Also, 55 percent of marketers produce social media graphics24 more than any other visual content. Hence, the demand for skilled designers will always be high and they’ll be paid well too25!
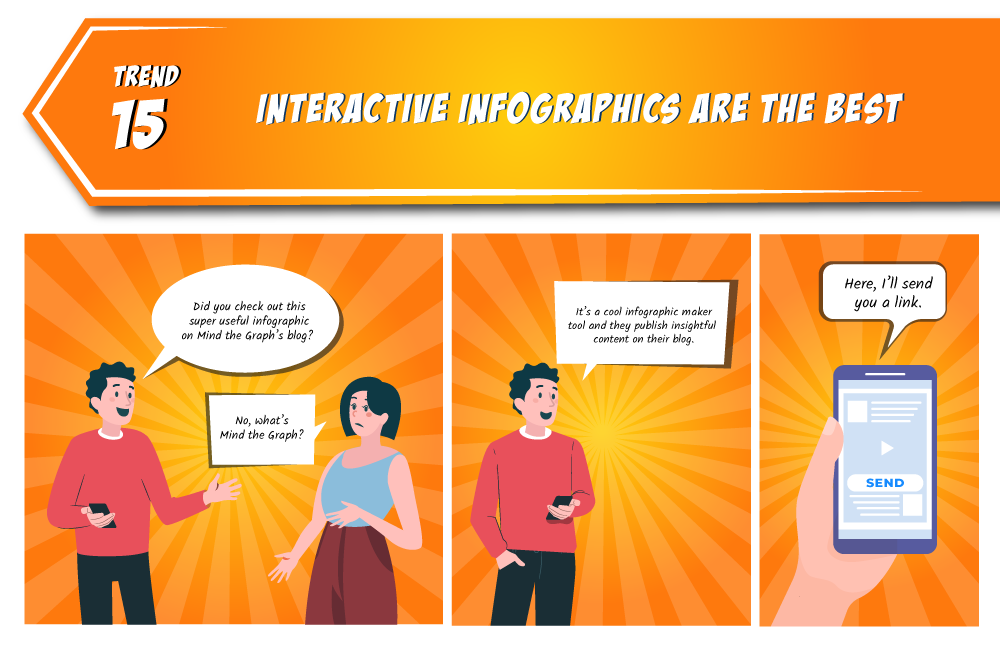
Trend 15: Interactive infographics are the best
The growing use of infographics is expected to reach a stage of saturation. Plain non-interactive are being overused by businesses. There’ll come a time when interactive infographics will be increasingly used by brands to stand out from the crowd of visual content.
Interactive infographics are a fantastic tool to entice people to explore your content, whether it’s a data set or a brand story. It helps improve user engagement and experience, thus boosting a site’s SEO. By investing in interactive content, such as interactive infographics an organization can become an authority in the subject and attract relevant organic traffic.
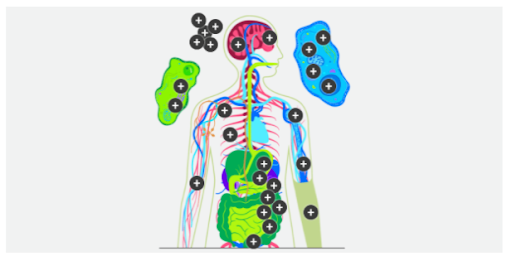
Check out these awesome examples of interactive infographics below.
The Evolution of the Web: This interactive infographic shares details on the growth of the web.

World’s Biggest Data Breaches: This infographic lets people see who’s been hacked and to what extent.

Vitamin Atlas: This infographic guides people through the body.
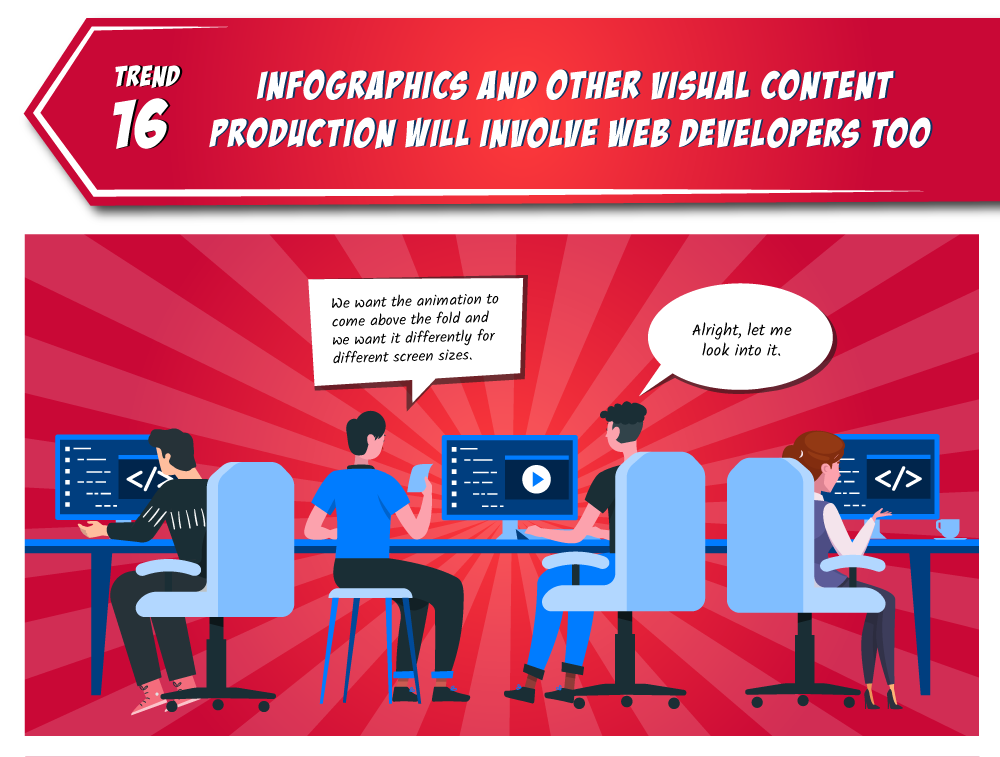
Trend 16: Web developers’ role in visual content production will grow
Whether interactive or not, infographics have a fantastic potential in content marketing. The future will see attractive design and programming going hand in hand to impress target audiences.
Hence, besides having graphic designers who work on Photoshop and Illustrator, you can expect to see web developers getting involved in the infographic and visual content production.
There will come a time when businesses will design their entire website to present content in the form of an infographic.
This will increase the demand for web developers who are experts in programming languages like JavaScript and CSS.
Involving web developers will ensure that the website and the infographic elements are responding effortlessly on hardware and software infrastructure.
Conclusion
By now you are surely convinced that visual content is the way to go for marketers who want their brands to stand out from the crowd.
Businesses who embrace visual content stand to win through high returns in the form of followers, shares, likes, and finally revenue.
The visual content domain has always been evolving with innovative marketers reimagining their marketing strategies and finding fresh and creative ways to enthuse their audience. In such a dynamic scenario, it pays to know the upcoming trends.
Whether you are a global brand, a non-profit firm, or a small business, the above-mentioned trends will guide your digital media strategy and help you top your visual content game.
If this post has added value to you, it sure will interest your friends and colleagues too! Like and share this post with those you think will benefit from it.
Because we know how infographics go well with our audience, we have created one that summarizes each of the trends above. Do let us know what you think!
- You Now Have a Shorter Attention Span Than a Goldfish
- Not Another State of Marketing Report.
- 15 Visual Content Marketing Statistics to Know for 2021 [Infographic].
- BtoB Content Marketing.
- 14 Visual Content Stats to Guide Your Marketing Strategy in 2020 [Infographic].
- The Marketer’s Ultimate Guide to Link Bait.
- Guess which Content Types Get the Most Backlinks?
- How to Spot Visual, Auditory, and Kinesthetic-Learning Executives
- The Mind’s Eye.
- 10 stats that show why 2019 is the year of visual content.
- 20 Ways to Share Color Knowledge.
- Photos as Web Content.
- How Virtual Reality is Becoming Mainstream for Marketers [Gifographic]
- AR vs VR: The Challenges and Opportunities in 2019.
- 6 Storytelling Trends Marketing Leaders Should Know About.
- Patient preferences for visualization of longitudinal patient-reported outcomes data.
- Infographic: The Power of Visual Content.
- How Infographics Can Help Your Business – #infographic
- 40+ Significant Visual Content Marketing Statistics You Need To Know
- UGC Is the Key to Instagram Success [Study].
- Does UGC Really Impact Conversion Rate? [Video]
- Vanity Planet Increases Checkouts by 24% With Instagram Photos
- GETTING STARTED WITH CREATIVE AUTOMATION FOR ADVERTISERS AND AGENCIES.
- Create highly engaging social media graphics with Venngage.
- 27-1024 Graphic Designers.
- HOW OUR BRAINS ARE HARDWIRED FOR VISUAL CONTENT.
- Mind the Graph Blog.
- Ionic Facial Steamer
- Instagram Post.
- World’s Biggest Data Breaches & Hacks.
- An Interactive Guide to Nutrition and the Human Body

Subscribe to our newsletter
Exclusive high quality content about effective visual
communication in science.