Fishbone diagrams are a powerful tool for analyzing and solving complex problems. Also known as cause and effect diagrams or Ishikawa diagrams, they provide a visual representation of the various causes that contribute to a specific problem or effect. By identifying the root causes rather than focusing solely on symptoms, fishbone diagrams enable effective problem-solving and decision-making.
The Purpose Of Fishbone Diagrams
Fishbone diagrams serve a crucial purpose in root cause analysis. They help us dig deeper into a problem, uncover its underlying causes, and identify areas for improvement. The main objective of a fishbone diagram is to represent the cause-and-effect relationships visually, facilitating a systematic approach to problem-solving.
How To Draw A Fishbone Diagram?
Follow this systematic implementation routine:
- Assemble Your Team and Identify the Problem: Form a diverse team comprising individuals with different perspectives and expertise. Clearly define the problem that requires analysis and improvement.
- Brainstorm Specific Causes within Each Factor: Conduct brainstorming sessions to generate potential causes related to each factor. Encourage open-mindedness and creativity to explore all possible causes.
- Ask “Why” for Each Cause: Iteratively ask “why” for each cause to delve deeper into the underlying factors. Challenge assumptions and dig beyond surface-level explanations.
- Identify the Potential Factors Causing the Problem: Use the main cause categories commonly employed in fishbone diagrams: people, process, equipment, materials, environment, and management. Customize the factors based on the specific problem under analysis.
- Investigate, Evaluate, and Correct Causes: Thoroughly investigate each cause and evaluate its significance in contributing to the problem. Implement corrective actions to address the root causes and prevent recurrence.
- Save and Share Your Diagram: Save the completed fishbone diagram for future reference and collaboration. Share it with team members or stakeholders to gather feedback and insights.
Fishbone Diagram Example
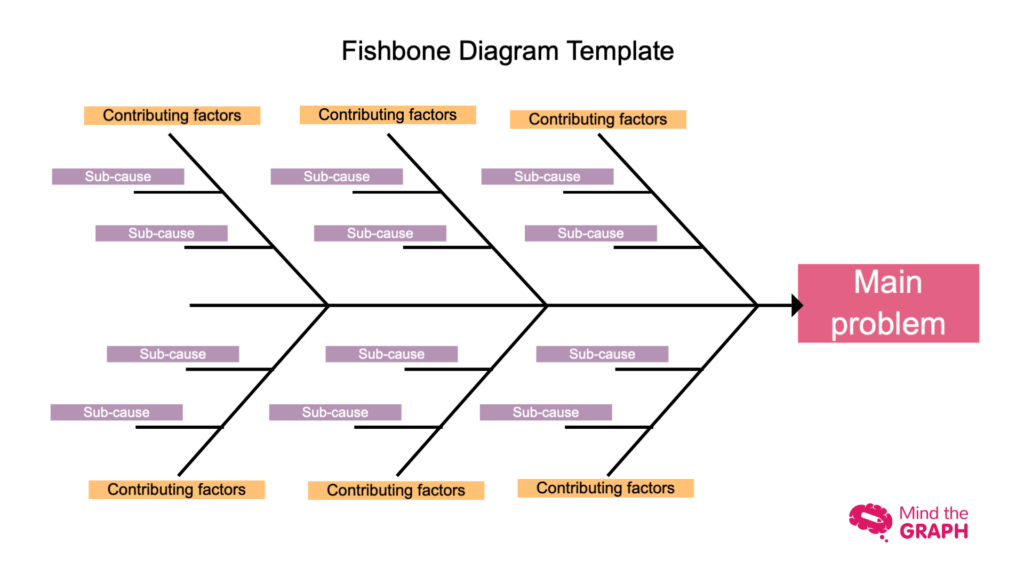
This template is available to edit on our platform. Click here to start editing it.
Alternative Tools For Fishbone Diagrams
In addition to manual drawing, there are online tools available, such as Gliffy, that offer user-friendly interfaces for creating fishbone diagrams. These digital tools enhance collaboration and sharing capabilities, making it easier to involve stakeholders and work collectively towards solutions.
Pros And Cons Of Fishbone Diagrams
Pros
- Provides a visual representation that aids in understanding complex problems and their causes;
- Facilitates brainstorming sessions and encourages a systematic approach to problem-solving;
- Promotes team collaboration and fosters a shared understanding of the problem.
Cons
- Simplification can lead to oversights or missing critical causes;
- Subjective categorization may vary between individuals or teams;
- Skilled facilitation is necessary to ensure accurate and unbiased analysis.
Three Tips For Facilitating A Fishbone Diagram
Create A Supportive Environment
- Foster an atmosphere that encourages open communication and diverse perspectives.
- Ensure everyone feels comfortable sharing their ideas and opinions.
Encourage Diverse Perspectives
- Emphasize the importance of considering different viewpoints to gain a comprehensive understanding of the problem.
- Encourage participants to think outside the box and challenge existing assumptions.
Capture All Ideas
- Establish a system for capturing and documenting all ideas generated during the brainstorming sessions.
- Avoid prematurely dismissing any potential causes, as even seemingly insignificant factors may have a significant impact.
What Is the Cause-and-Effect Fishbone Diagram?
A cause-and-effect fishbone diagram is a visual representation that shows the cause-effect relationship between various factors contributing to a specific problem or outcome. It allows for a comprehensive analysis by categorizing causes into different factors and sub factors.
Health Care Problem-solving Toolkit
Fishbone diagrams are particularly valuable in healthcare settings for problem-solving and improving patient care. They enable healthcare professionals to identify the root causes of medical errors, delays in treatment, or other challenges. By understanding the underlying causes, healthcare organizations can implement effective solutions and enhance patient outcomes.
Conclusion
In conclusion, fishbone diagrams are a powerful tool for root cause analysis and problem-solving. By visually representing the causes and effects related to a problem, they facilitate a structured and systematic approach to identifying root causes.
While fishbone diagrams have their limitations, they offer immense value in various fields, including education, research, and healthcare. By embracing fishbone diagrams, teachers, students, and researchers can gain valuable insights, improve decision-making, and foster innovation.
Create Your Fishbone Diagram With Mind the Graph
We gathered a scientist and a designer to create the best tool for scientific design. Mind the Graph offers a collection of scientifically accurate illustrations along with many design features that will help you create perfect Graphical Abstracts, Infographics, Posters, Presentations, and more. Sign up for free and trust the power of visuals.


Subscribe to our newsletter
Exclusive high quality content about effective visual
communication in science.