3 min læsning
03/19/2018
Mind The Graph Scientific Blog er beregnet til at hjælpe forskere med at lære, hvordan man kommunikerer videnskab på en ukompliceret måde.
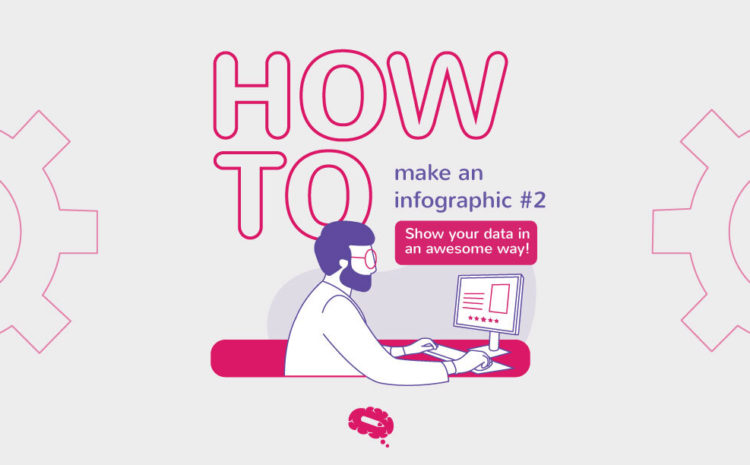
Dette er det tredje indlæg i serien Sådan laver du en infografik. Hvis du gik glip af det sidste indlæg, kan du læse det her. Nu hvor du kender dit brændende problem, hovedspørgsmålet i din forskning, og også har data til at besvare dette spørgsmål, er det tid til at vælge den bedste måde at vise det på [...].
Sådan laver du en infografik-serie Dette er det andet indlæg i serien Sådan [...].
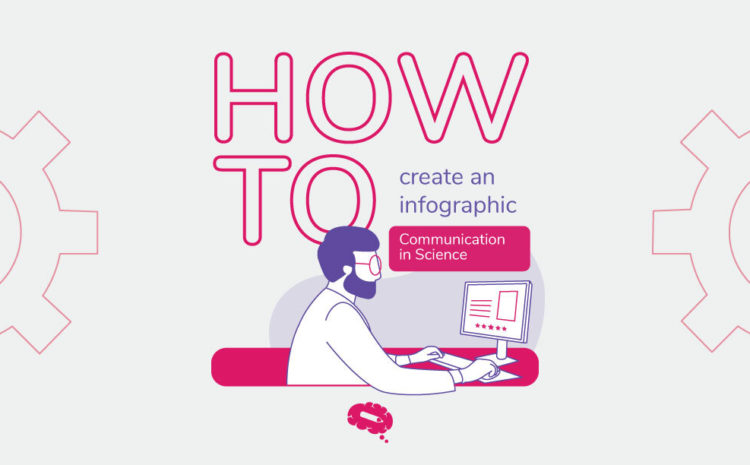
Se, hvordan man laver en infografik Kommunikation er en vigtig del af det videnskabelige liv. Og [...]
I dag fejrer vi Darwins dag til ære for Charles Darwin, der blev født den 12.02.1809. Darwin [...]
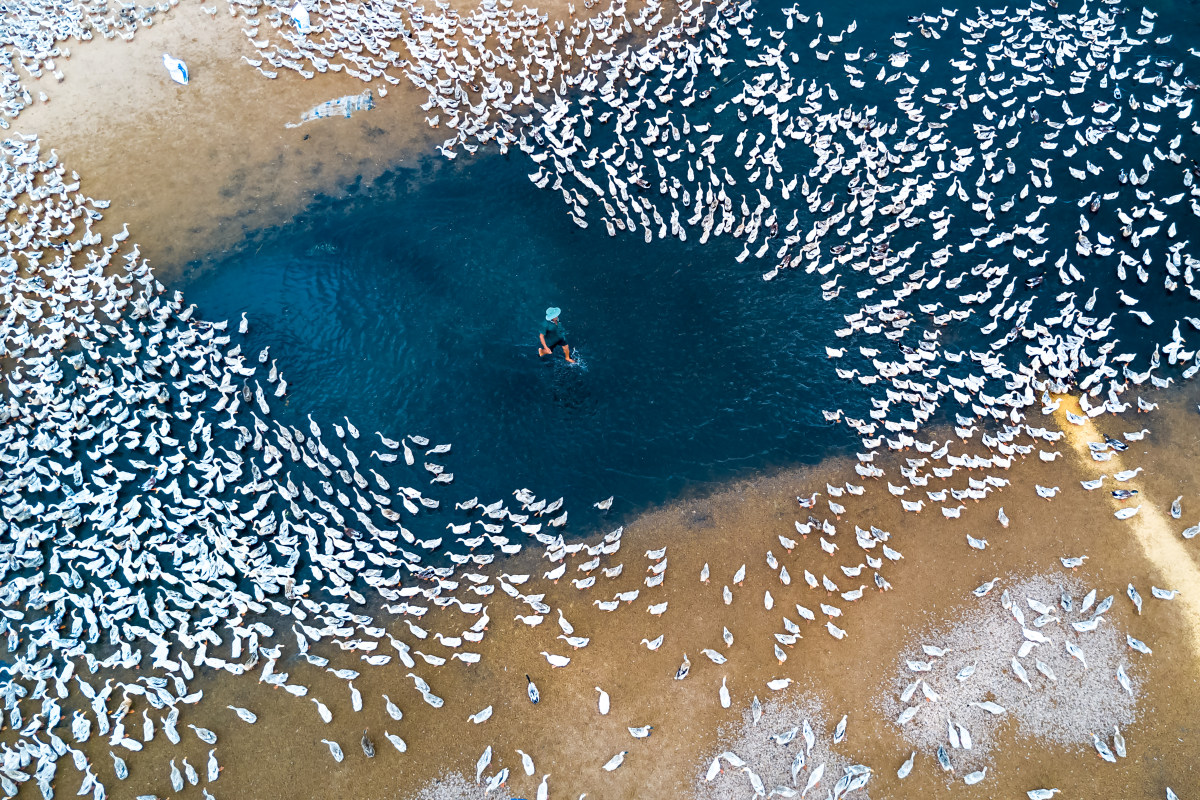
SkyPixel er den vigtigste konkurrence i verden inden for luftfotografering med over 44.000 [...]
A inovação científica e tecnológica se desenvolveu na velocidade da luz, enquanto a comunicação científica [...]
Nogle gange betyder det at være forsker, at man oplever usædvanlige eller sjove situationer under arbejdet. Rutinen med [...]
Hej med jer! I dag vil jeg dele mine yndlingslinks om videnskab med dig, som jeg har fundet ud af i disse dage. [...]
Det er fredag, og vi har fortjent en lille pause. Jeg ved godt, at mange forskere arbejder og skriver [...].
I film er hajer som regel frygtløse rovdyr, kødhungrende monstre. Men i det virkelige liv er de [...]
Næsten lige så vigtigt som at have solide resultater om sin forskning er det at præsentere dem godt. [...]
Du fortjener en kort pause på arbejdet for at se dette. Videnskab er trods alt ikke kun [...].
Vi kan virkelig godt lide at vise vores brugeres utrolige arbejde frem - især hvis de er [...]