
Reliability takes center stage when variables produced from summated scales are employed as predictive components in objective models. Because summated scales are made up of interconnected items that are meant to assess underlying variables, it is critical to know if the same collection of items would result in the same responses to identical questions if they were recast and re-administered to the same respondents.
Variables are only claimed to be reliable once they provide steady and reliable reactions throughout several administrations of the test.
Cronbach’s Alpha is a method for obtaining the answers required to claim the reliability of variables. Continue reading to discover more about Cronbach’s Alpha and how to interpret it.
What is Cronbach’s Alpha and what is it used for?
Cronbach’s alpha is a method of evaluating reliability that compares the amount of shared variable, or covariance, between many items that comprise an instrument to the quantity of the total variable. If the instrument is reliable, there must be a lot of covariances between all items in relation to the variance.
Cronbach’s alpha is calculated by averaging all conceivable split-half reliabilities. Cronbach’s alpha may be calculated by the majority of statistical software programs now in use and they are frequently useful to investigate what Cronbach’s alpha becomes once a certain item is eliminated. If Cronbach’s alpha increases significantly after removing an item, the item may not belong in the measure.
What exactly does that mean? Let’s start with reliability. Assume a person completes a Satisfaction Survey. If the same or comparable findings are obtained when the same individual retakes your survey under identical settings, your satisfaction score is very dependable (constant). However, if an individual takes the Satisfaction Survey twice back-to-back while maintaining the same level of genuine satisfaction and one score exhibits strong satisfaction and the other score shows low satisfaction, that measure would be completely unreliable.
To make it simply said, Cronbach’s alpha provides a straightforward technique to determine whether or not a score is reliable. It is used with the idea that you have numerous items measuring the same underlying factor: for example, for the Satisfaction Survey, you may have six questions, each asking a distinct concern, but when combined, they could be considered to measure overall satisfaction.
Cronbach’s Alpha Formula
Cronbach’s alpha is usually calculated for you using statistical software. Knowing how to calculate it yourself, on the other hand, might help you comprehend it.
Cronbach’s alpha is calculated as follows.
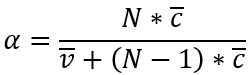
N = is the number of things.
c̅ = denotes the covariance between elements.
v̅ = denotes the item variance.
Cronbach’s alpha is computed by dividing the average covariance by the average total variance. A substantial covariance relative to the item variance is required for a high alpha value, and the connection between the questions accounts for the majority of the overall variability. It’s also worth mentioning that when more elements are added, Cronbach’s alpha tends to rise.

How to interpret it?
Assume a consulting firm wishes to take a survey to see how happy consumers are with the promptness of its service. You create the four survey questions shown below:
Items:
- My query was responded to in a timely manner.
- I am pleased with the promptness with which the service was given.
- The amount of time I had to wait for services was acceptable.
- I am pleased with the services provided.
These questions all utilize a 5-point Likert scale, with 1 being very unsatisfied and 5 being very satisfied.
To do this analysis, you must calculate first of all the overall Cronbach’s alpha and then recalculate omitting every item, to acquire additional insights and important information about each item.
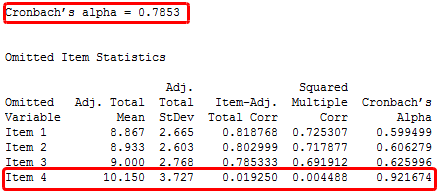
Cronbach’s alpha is 0.7853 overall. Most people would consider it acceptable. However, omitting item 4 resulted in a score of 0.921674, indicating that only items 1, 2, and 3 represent customer service promptness. Item 4 should be removed or revised and retested.
High impact and greater visibility for your work
By using visual assets in your work, you may increase its visibility and get remembered. People recall images they see far more than words they read, thus visual assets are the ideal approach to boost understandability. Use Mind The Graph to produce stunning infographics, illustrations, and posters to support your work.


Subscribe to our newsletter
Exclusive high quality content about effective visual
communication in science.