BMJ is one of the prestigious medical journals out there and publishing a paper in it is like a dream come true moment for all the researchers. To do so, you need to make sure that your paper is in top condition and graphical abstracts help you make it to the top.
Confused about what a graphical abstract is? Worry not, this article got you covered. This is where you will understand everything about graphical abstracts and how to create a graphical abstract for BMJ. So without further ado, let us get started!
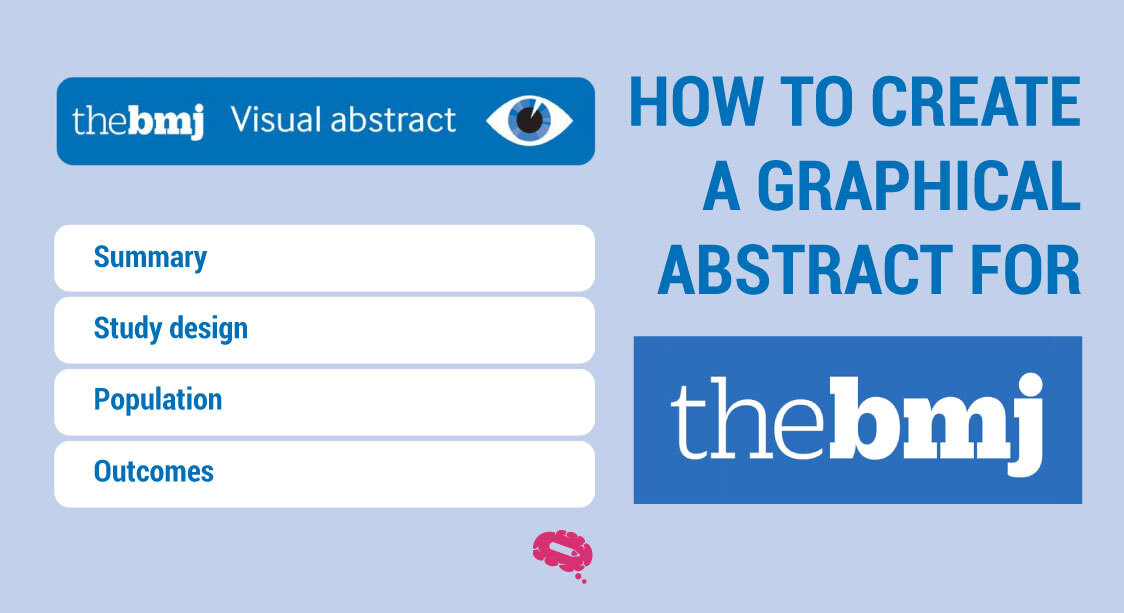
How to Create a Graphical Abstract for BMJ
A graphical abstract is a visual summary of your research, designed to quickly convey the essence of your study. For a BMJ submission, it should be clear, concise, and informative, highlighting key findings and their significance.
Use simple, engaging graphics and minimal text to make it easily understandable. Focus on the main message, avoiding unnecessary details.
Ensure your abstract aligns with BMJ guidelines, which may include specific dimensions, resolution, and format requirements. A well-crafted graphical abstract can enhance the visibility and impact of your research.

Understanding a Graphical Abstract
A graphical abstract is a visual summary of a research article designed to convey the main points of the study quickly and effectively.
It usually includes images, diagrams, and brief text that highlight the key findings and significance of the research. The primary purpose of a graphical abstract is to make the content more accessible, helping readers grasp the essence of the study at a glance.
This can be particularly useful in scientific communication, where complex information needs to be communicated efficiently to a broad audience, including those who may not have a deep understanding of the subject.
Components of a Graphical Abstract
- Visual Elements: These include images, diagrams, charts, and other graphical representations that illustrate the core aspects of the research. Visual elements should be simple yet informative, focusing on the most important parts of the study.
- Textual Elements: While the emphasis is on visuals, some text is necessary to provide context and clarity. This may include titles, brief descriptions, and labels for different parts of the visual elements. The text should be concise and directly related to the visuals.
- Color and Design Principles: Effective use of color can enhance the clarity and attractiveness of the graphical abstract. Use contrasting colors to differentiate parts of the visual elements and ensure readability. Design principles such as balance, alignment, and simplicity are crucial for creating an engaging and easy-to-understand graphical abstract. Keep the design clean and avoid overcrowding with too much information.
Preparing to Create a Graphical Abstract
To grasp the answer to the question “How to create a graphical abstract for BMJ?”, start by analyzing your research to identify the key findings that you want to highlight. These are the most important results or conclusions of your study that will capture the interest of your audience.
Once you have identified these key points, select the data that can be represented visually. This might include graphs, charts, or images that effectively illustrate your findings.
Choose data that is clear and impactful, making sure it can be easily understood when presented visually.
Considering Your Audience
When designing your graphical abstract, consider who will be viewing it. Tailor the complexity of the information to suit a general audience, as your abstract should be understandable by both experts in the field and non-specialists. Avoid using jargon or overly technical language. Instead, use simple terms and clear visuals that convey the message quickly.
Accessibility and readability are also crucial. Use large, readable fonts and ensure that any text is easily legible. Use contrasting colors to enhance visibility and ensure that the graphical elements are clear and not cluttered. The goal is to make your abstract easily accessible to a wide audience, ensuring that anyone who sees it can grasp the main points of your research without difficulty.
Designing Your Graphical Abstract
To design a graphical abstract, select suitable software that meets your needs. Recommended software includes Adobe Illustrator and CorelDRAW for advanced design features, though these are paid options.
Free alternatives like Canva and Inkscape offer robust tools for creating effective graphical abstracts without the cost. Microsoft PowerPoint and Google Slides can also be used for simpler designs.
Why Choose Mind the Graph for Your BMJ Graphical Abstract?
Mind the Graph stands out as the premier tool for creating graphical abstracts tailored for BMJ publications. With its user-friendly interface, extensive library of scientifically accurate illustrations, and customizable templates, Mind the Graph empowers researchers to craft visually compelling abstracts that effectively communicate complex findings. Whether you’re summarizing clinical trials or presenting epidemiological data, our platform ensures your abstracts not only meet BMJ’s rigorous standards but also captivate readers, enhancing the impact and visibility of your research. Create your Graphical Abstract for BMJ now using Mind the Graph.
Layout and Composition
When structuring your graphical abstract, ensure that the information flows logically. Start with the main finding or message at the top or center, then arrange supporting data and visuals around it. Aim for a balance between visuals and text, with visuals taking the lead. The text should be minimal but informative, providing a context where necessary. Make sure the layout is clean and not overcrowded, allowing viewers to easily follow the narrative.
Tips for Effective Visuals
Simplification is key for effective visuals. Break down complex data into simpler elements that can be easily understood. Use icons and symbols to represent concepts and findings visually.
These elements can quickly convey information without the need for lengthy explanations. Stick to a consistent color scheme and design style to maintain visual coherence. Use high-contrast colors for readability and ensure that all visuals are clear and not cluttered.
Keeping your design simple and focused will make your graphical abstract more engaging and easier to understand.
Best Practices for Graphical Abstracts
Following BMJ Guidelines
When creating a graphical abstract for BMJ, it’s crucial to adhere to their submission requirements. Check the BMJ guidelines for specifics on size, format, and resolution.
Typically, BMJ requires graphical abstracts to be clear and high-quality, often recommending a specific resolution (e.g., 300 dpi) and size dimensions. The format is usually JPEG or PNG, but it’s essential to verify the latest guidelines.
Following these requirements ensures your abstract is accepted and looks professional in the publication.
Common Pitfalls to Avoid
Overcomplicating Design
A common mistake is making the design too complex. Keep it simple and focused on the main findings of your research. Avoid including too much information or overly detailed graphics that can confuse the audience. The goal is to make the information easily digestible at a glance.
Misusing Color and Fonts
Incorrect use of color and fonts can detract from the effectiveness of your graphical abstract. Use a consistent and limited color palette that enhances readability and comprehension. Avoid using too many colors or overly bright, clashing hues. For fonts, choose clean, easy-to-read styles and maintain a consistent size and type throughout the abstract. Avoid decorative fonts that can be hard to read and distract from the content.
By following these best practices, you can create a clear, effective, and visually appealing graphical abstract for your BMJ submission.
Finalizing and Submitting Your Graphical Abstract
Reviewing and Refining
Before submitting your graphical abstract, it’s essential to review and refine it. Seek feedback from peers or colleagues who can provide constructive criticism. They can help identify any areas that might be confusing or unclear. Ensure the information is accurate and that the visuals effectively convey your key findings.
Submission Process
When you’re ready to submit, make sure you upload the correct file type as specified by BMJ. Typically, this will be a high-resolution JPEG or PNG file. Double-check the file format requirements in the BMJ submission guidelines to ensure compliance.
Also, review the specific standards for graphical abstracts, including size, resolution, and any other technical specifications. Ensure your file meets these standards to avoid any issues during the submission process.
Once everything is in order, follow the BMJ submission instructions carefully, attaching your graphical abstract along with your manuscript.
By ensuring your graphical abstract is clear, accurate, and compliant with BMJ’s standards, you enhance the chances of your research being effectively communicated and well-received by the audience.
Conclusion: Elevate Your Research Impact with Mind the Graph
In conclusion, Mind the Graph offers unparalleled support for creating graphical abstracts that elevate the visibility and impact of your research in BMJ publications. By leveraging our intuitive tools, vast illustration library, and customizable templates, researchers can confidently craft abstracts that not only meet BMJ’s stringent requirements but also effectively engage readers. Empower your research with Mind the Graph and ensure your findings resonate with audiences worldwide, driving scientific discourse and advancement.
Related Article: How To Create A Graphical Abstract For Elsevier Publishing
Discover the Power of Captivating Graphical Abstracts with Mind the Graph
Mind the Graph is an exclusive platform where you can discover the power of captivating graphical abstracts – All for Free. From medical sciences to microbiology, you can explore 75,000+ illustrations across 80+ fields. Subscribe now to transform your research today!


Subscribe to our newsletter
Exclusive high quality content about effective visual
communication in science.