3 minutos de leitura
07/29/2022
Mind The Graph Scientific Blog foi criado para ajudar os cientistas a aprender a comunicar a ciência de uma forma descomplicada.
Este artigo analisará o que são artigos revisados por pares e por que é considerado necessário para garantir a qualidade científica acadêmica
Descubra que tipo de conclusão melhor se adapta à sua pesquisa, como escrevê-la passo a passo e os erros comuns a evitar.
Aprenda sobre a posição anatômica e porque elas são tão importantes para cada espécie de organismo na medicina.
Descubra as muitas formas de plágio, as melhores maneiras de preveni-lo e como determinar se seu trabalho o contém acidentalmente.
Entenda o que é análise post-hoc e como encontrar dados e padrões valiosos após a conclusão do estudo.
Aprenda como resumir seus artigos de forma eficaz utilizando estas técnicas simples e as melhores práticas do setor.
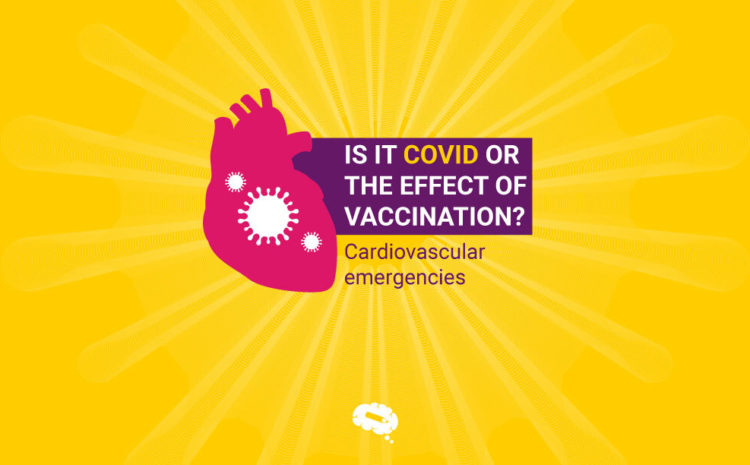
O artigo em destaque fala sobre várias complicações cardíacas causadas pela COVID-19 durante seu ciclo de infecção e seus efeitos a longo prazo.
Melhore seu relatório de pesquisa e aprenda como desenvolver uma hipótese precisa e completa para sua pesquisa.
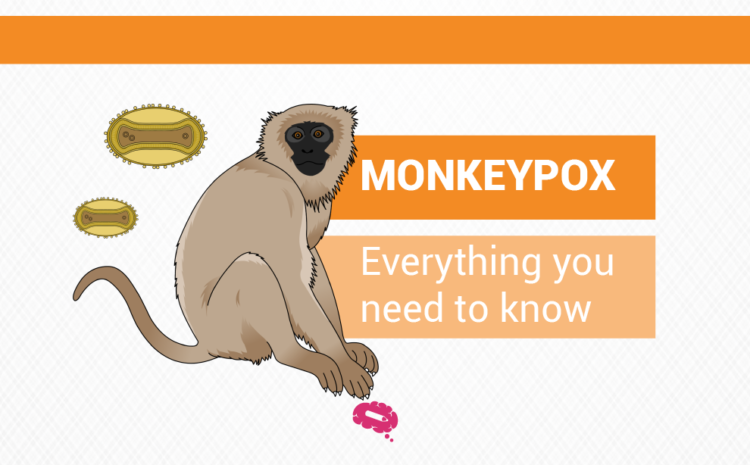
Neste artigo, damos uma olhada no que é a varíola macaco e como identificar seus sintomas e recomendar medidas para preveni-la.
Entenda como conduzir uma pesquisa de análise conceitual mais precisa e detalhada para convertê-la em um conceito mais concreto.
Este artigo explicará qual é a melhor abordagem para comunicar as informações ao seu público, incluindo figuras em um artigo de pesquisa.
Aqui está um guia para ajudá-lo a escrever uma boa declaração de problema, entendendo a importância de suas qualidades, elementos e estrutura.
Os slides apresentam a essência do conteúdo de forma muito vantajosa se você tirar proveito de dicas comprovadas em formatação.