As you know, every week we add new scientific illustrations to our library in Mind the Graph. We have over eight thousands illustrations now and all them are available to all mind the graph users. Most of our illustrations are made by requests from our subscribers. If you are a subscriber, you can request new illustrations at no extra cost. If you aren’t a subscriber yet, but you want to show your results in a visual way, don’t waste more time:
La oss nå ta en titt på ukens nye illustrasjoner:
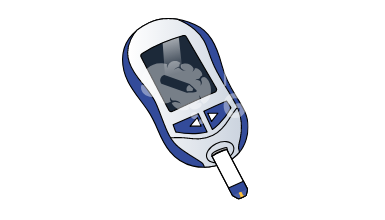
Glukometer
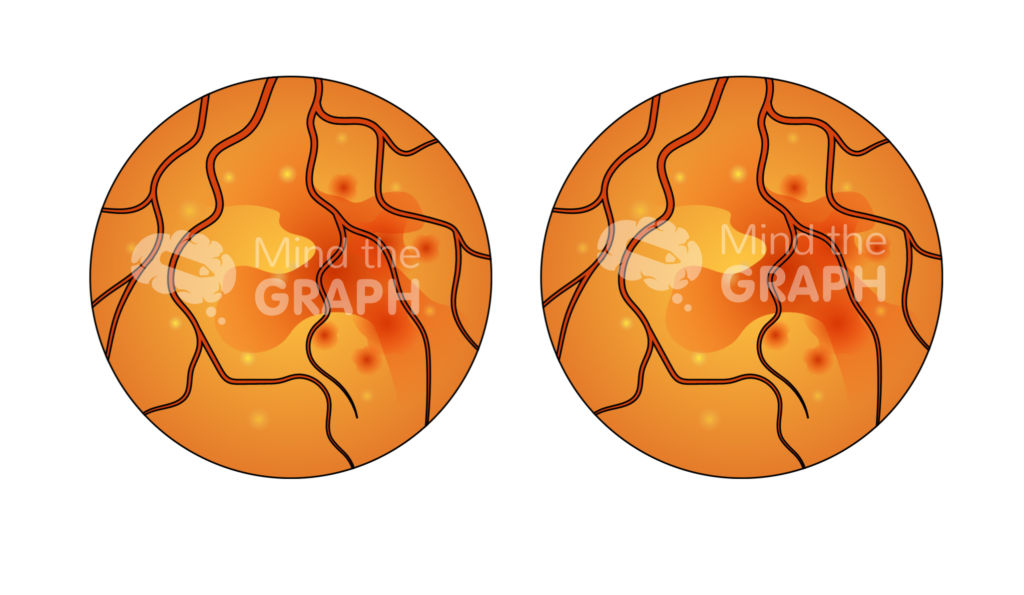
Chorioretinitt
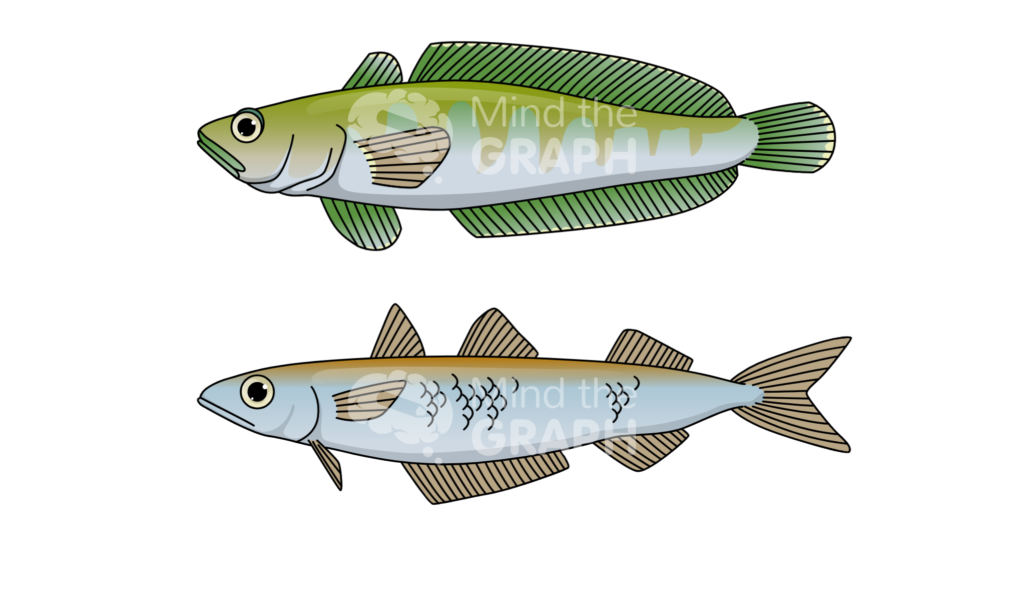
Gulfinnet notot og sørlig kolmule
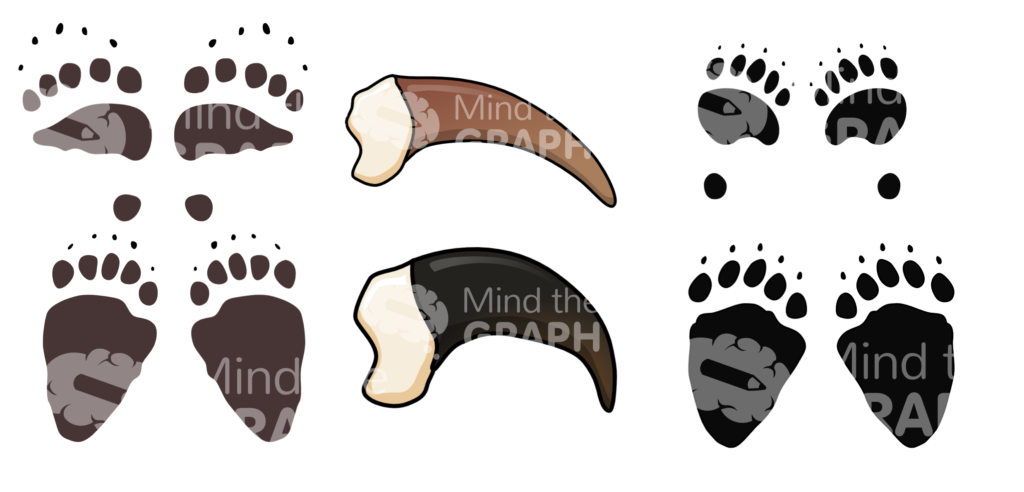
Fotavtrykk og klør etter bjørn
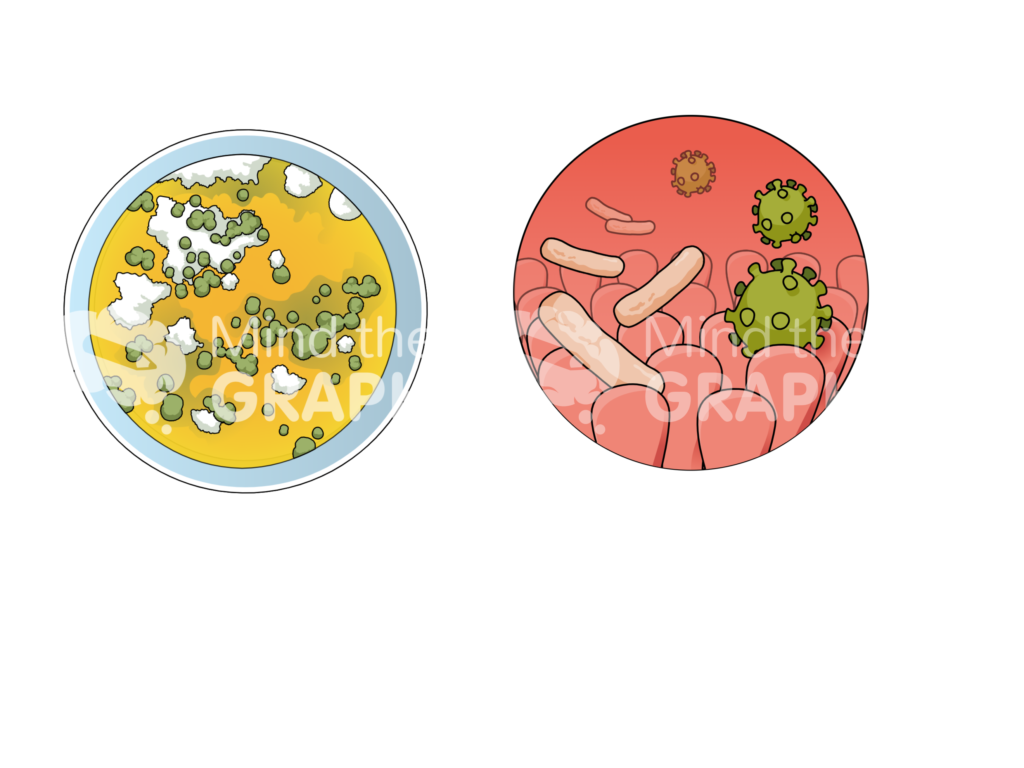
Biofilm og petriskål
La oss nå se de nyeste vitenskapelige illustrasjonene som er tilgjengelige i Mind the Graph:

Abonner på nyhetsbrevet vårt
Eksklusivt innhold av høy kvalitet om effektiv visuell
kommunikasjon innen vitenskap.


