Vi tilbyr maler til brukerne våre, slik at de ikke trenger å starte med blanke ark. Det er den beste måten å spare tid og skape noe iøynefallende på.
Det er veldig enkelt å bruke en grafisk abstrakt mal. Hvis du er abonnent, trenger du bare gå til galleriet vårt and choose the best template for you, click on it and start to create your infographic. Also you can select a template inside your workspace. This way you can try different styles and select your favourite. If you aren’t a subscriber, you can use the templates as an inspiration to your creation or invest a few dollars for å få tilgang til alle funksjonene i grafen.
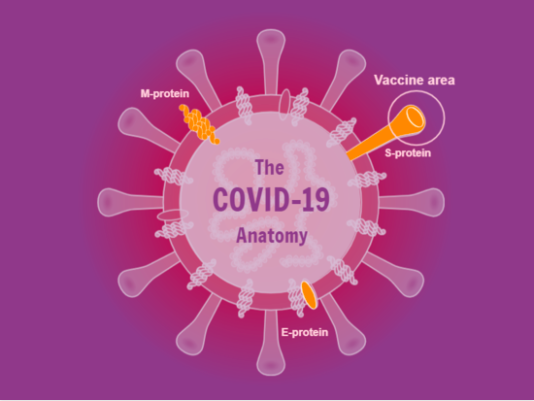
Learn in the video tutorial below how to create an infographic in Mind the Graph. The topic of the week is… guess what… coronavirus Covid-19 anatomy. One can’t get enough of this topic, right?
Hvis du likte videoen, kan du gå til Mind the Graph Youtube-kanal for ukentlig oppdatering.
-
- Spillelisten "Visuelle tips" for infografikkvideoer med veiledning:
-
- Spilleliste med opplæringsvideoer om hvordan du bruker funksjonene i Mind the Graph

Abonner på nyhetsbrevet vårt
Eksklusivt innhold av høy kvalitet om effektiv visuell
kommunikasjon innen vitenskap.


