1 min lesning
07/26/2019
Vitenskapsbloggen Mind The Graph er ment å hjelpe forskere med å lære å kommunisere vitenskap på en ukomplisert måte.
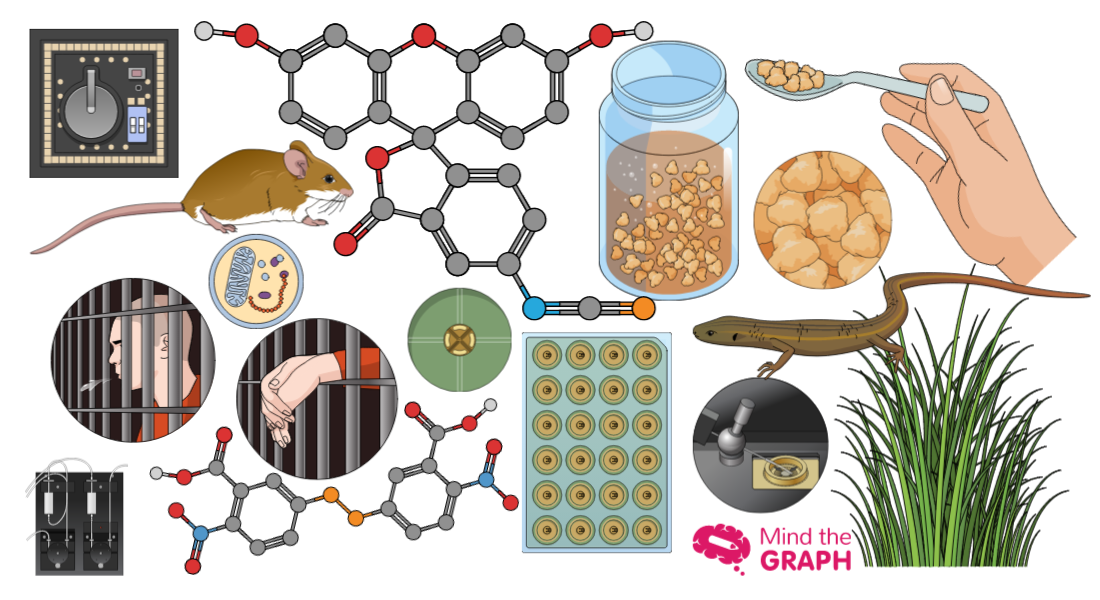
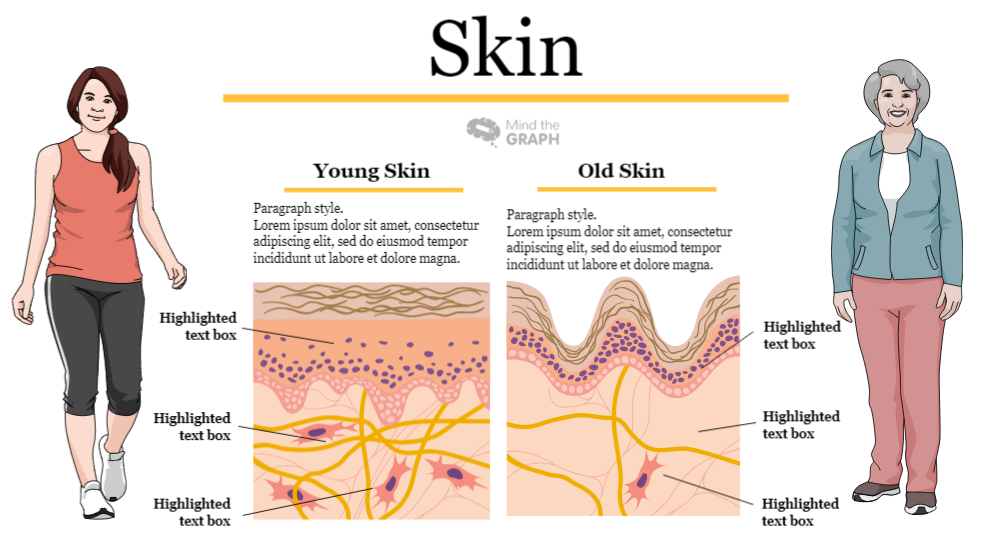
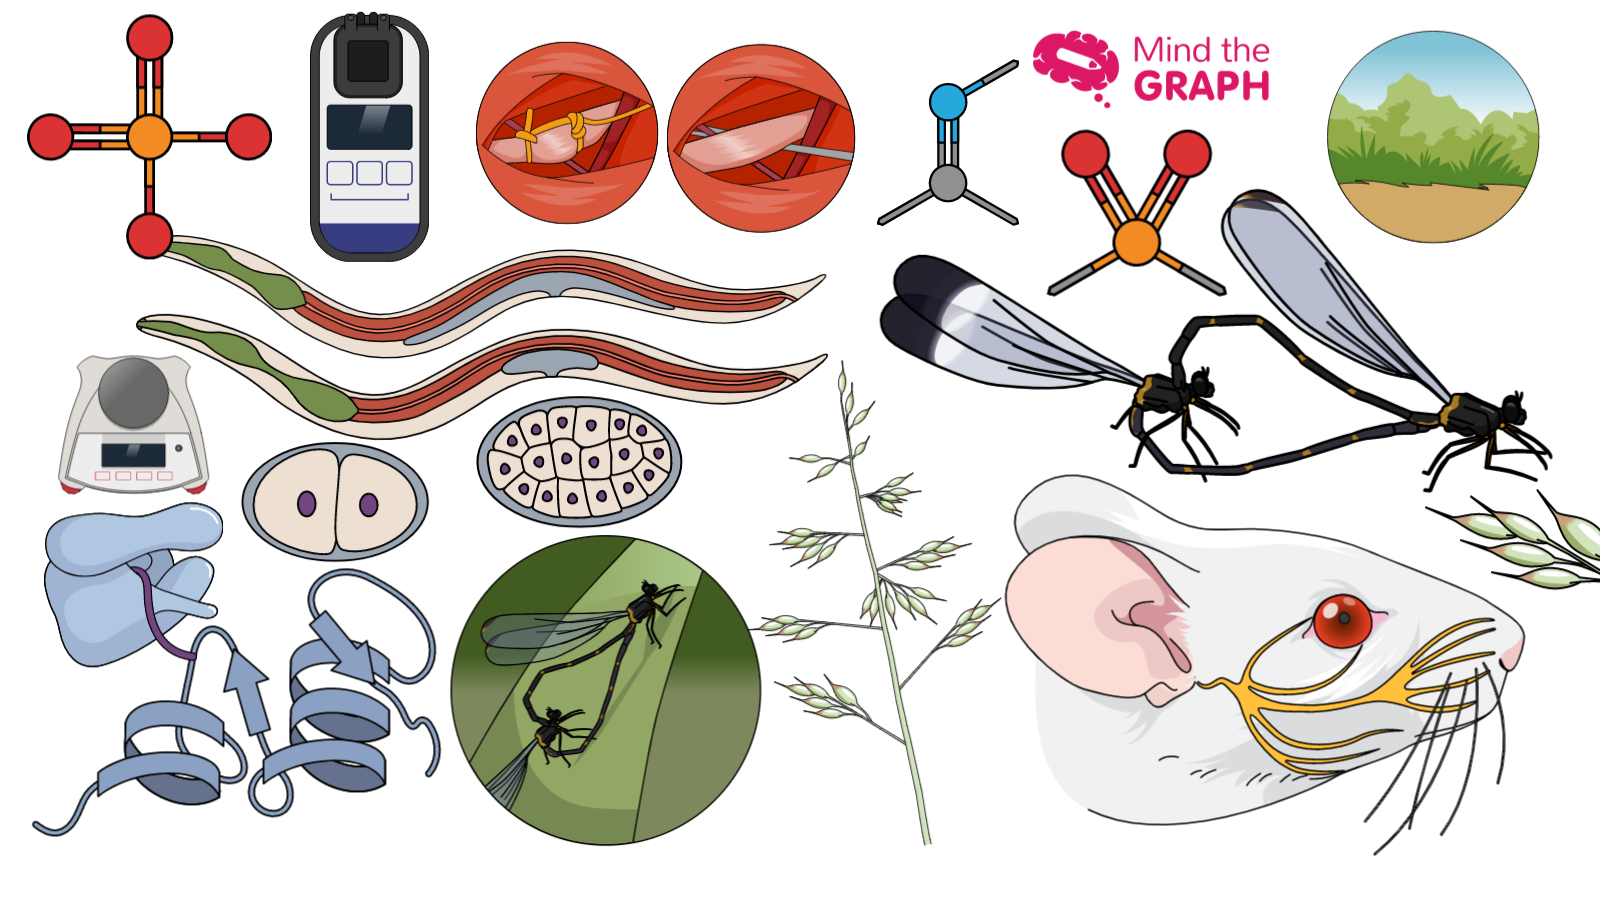
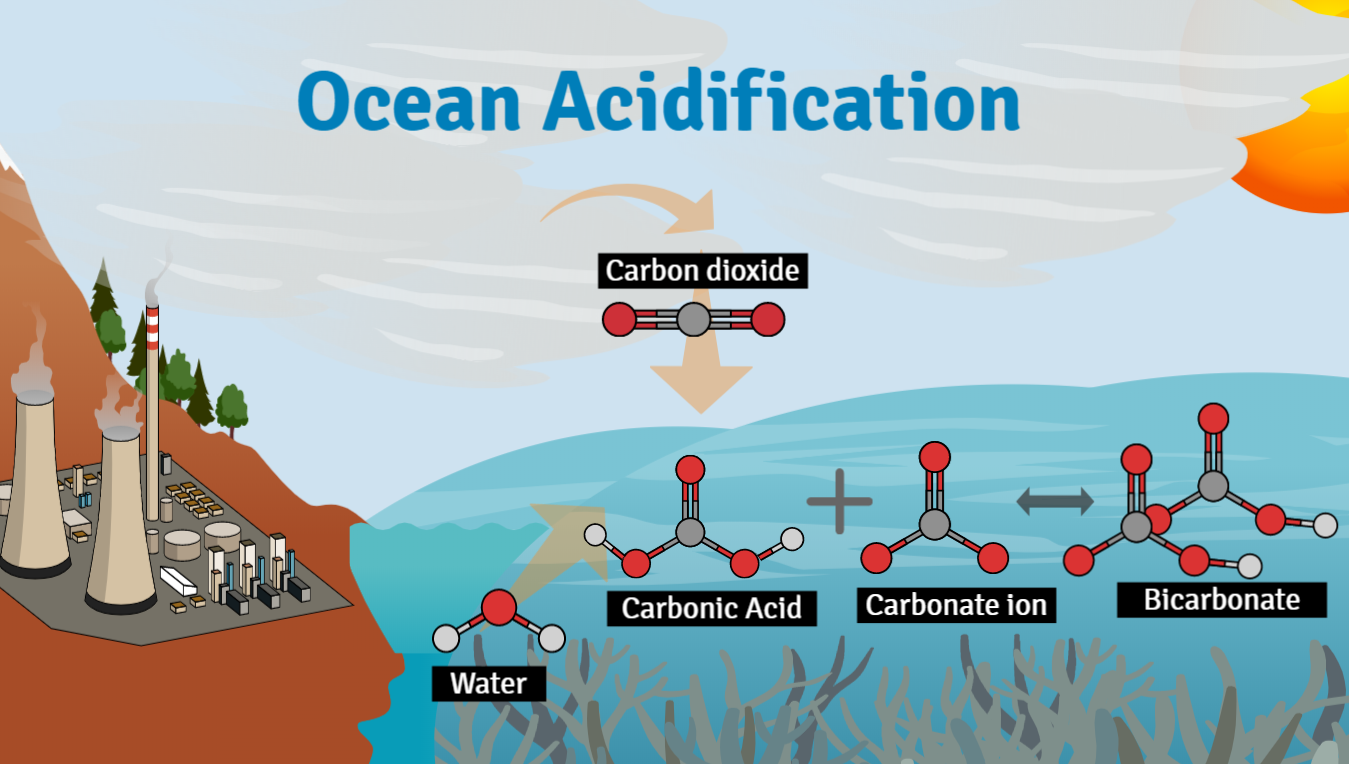
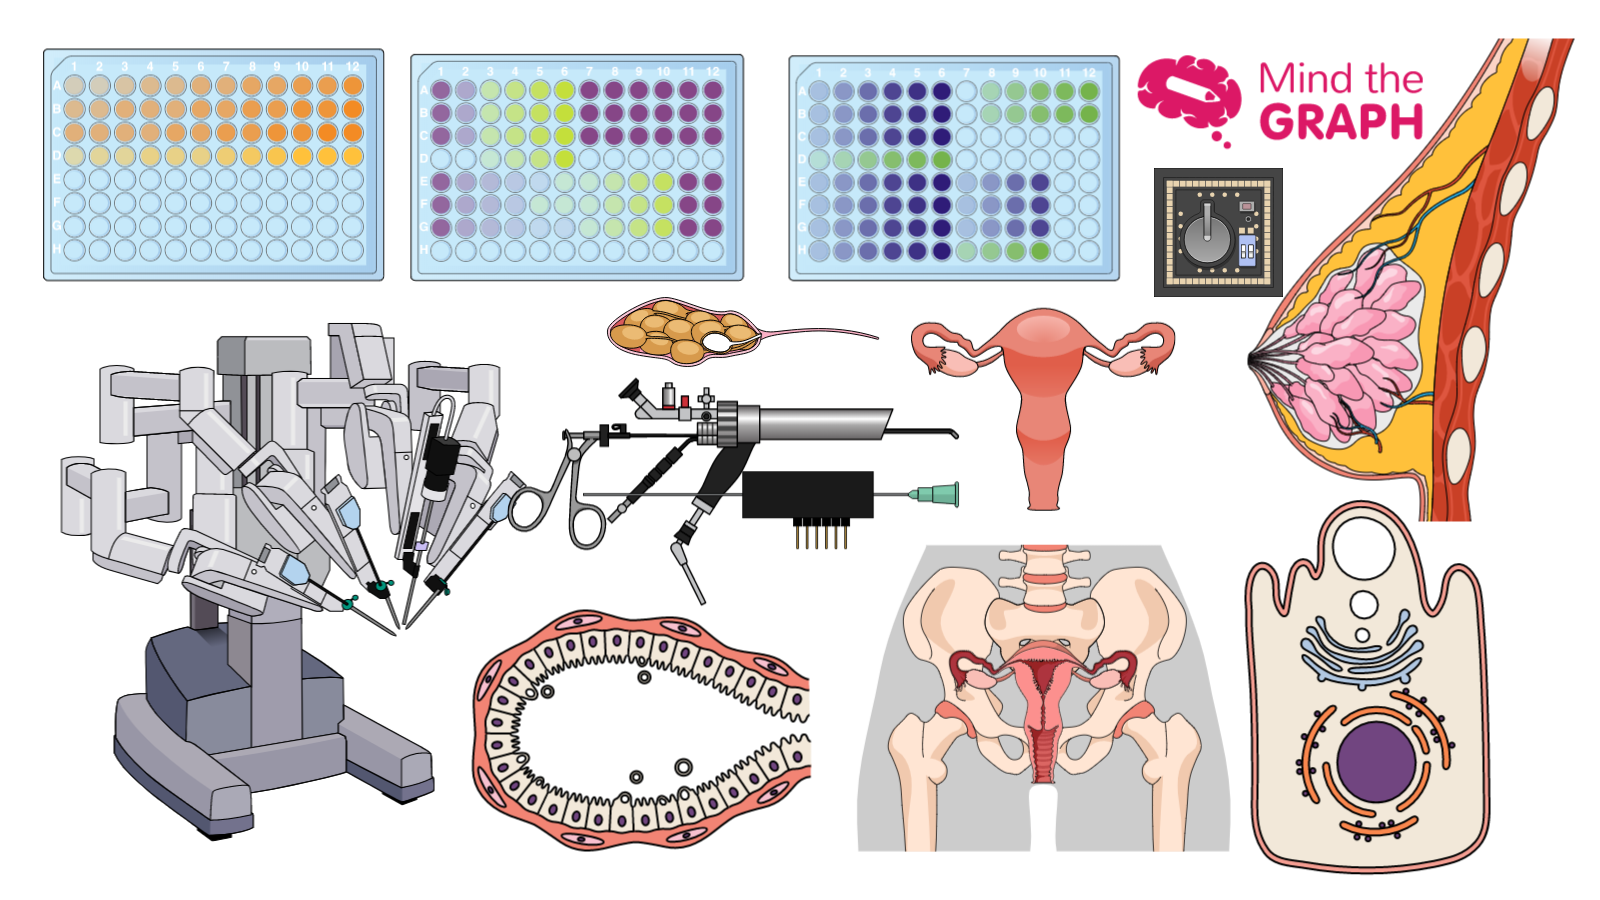
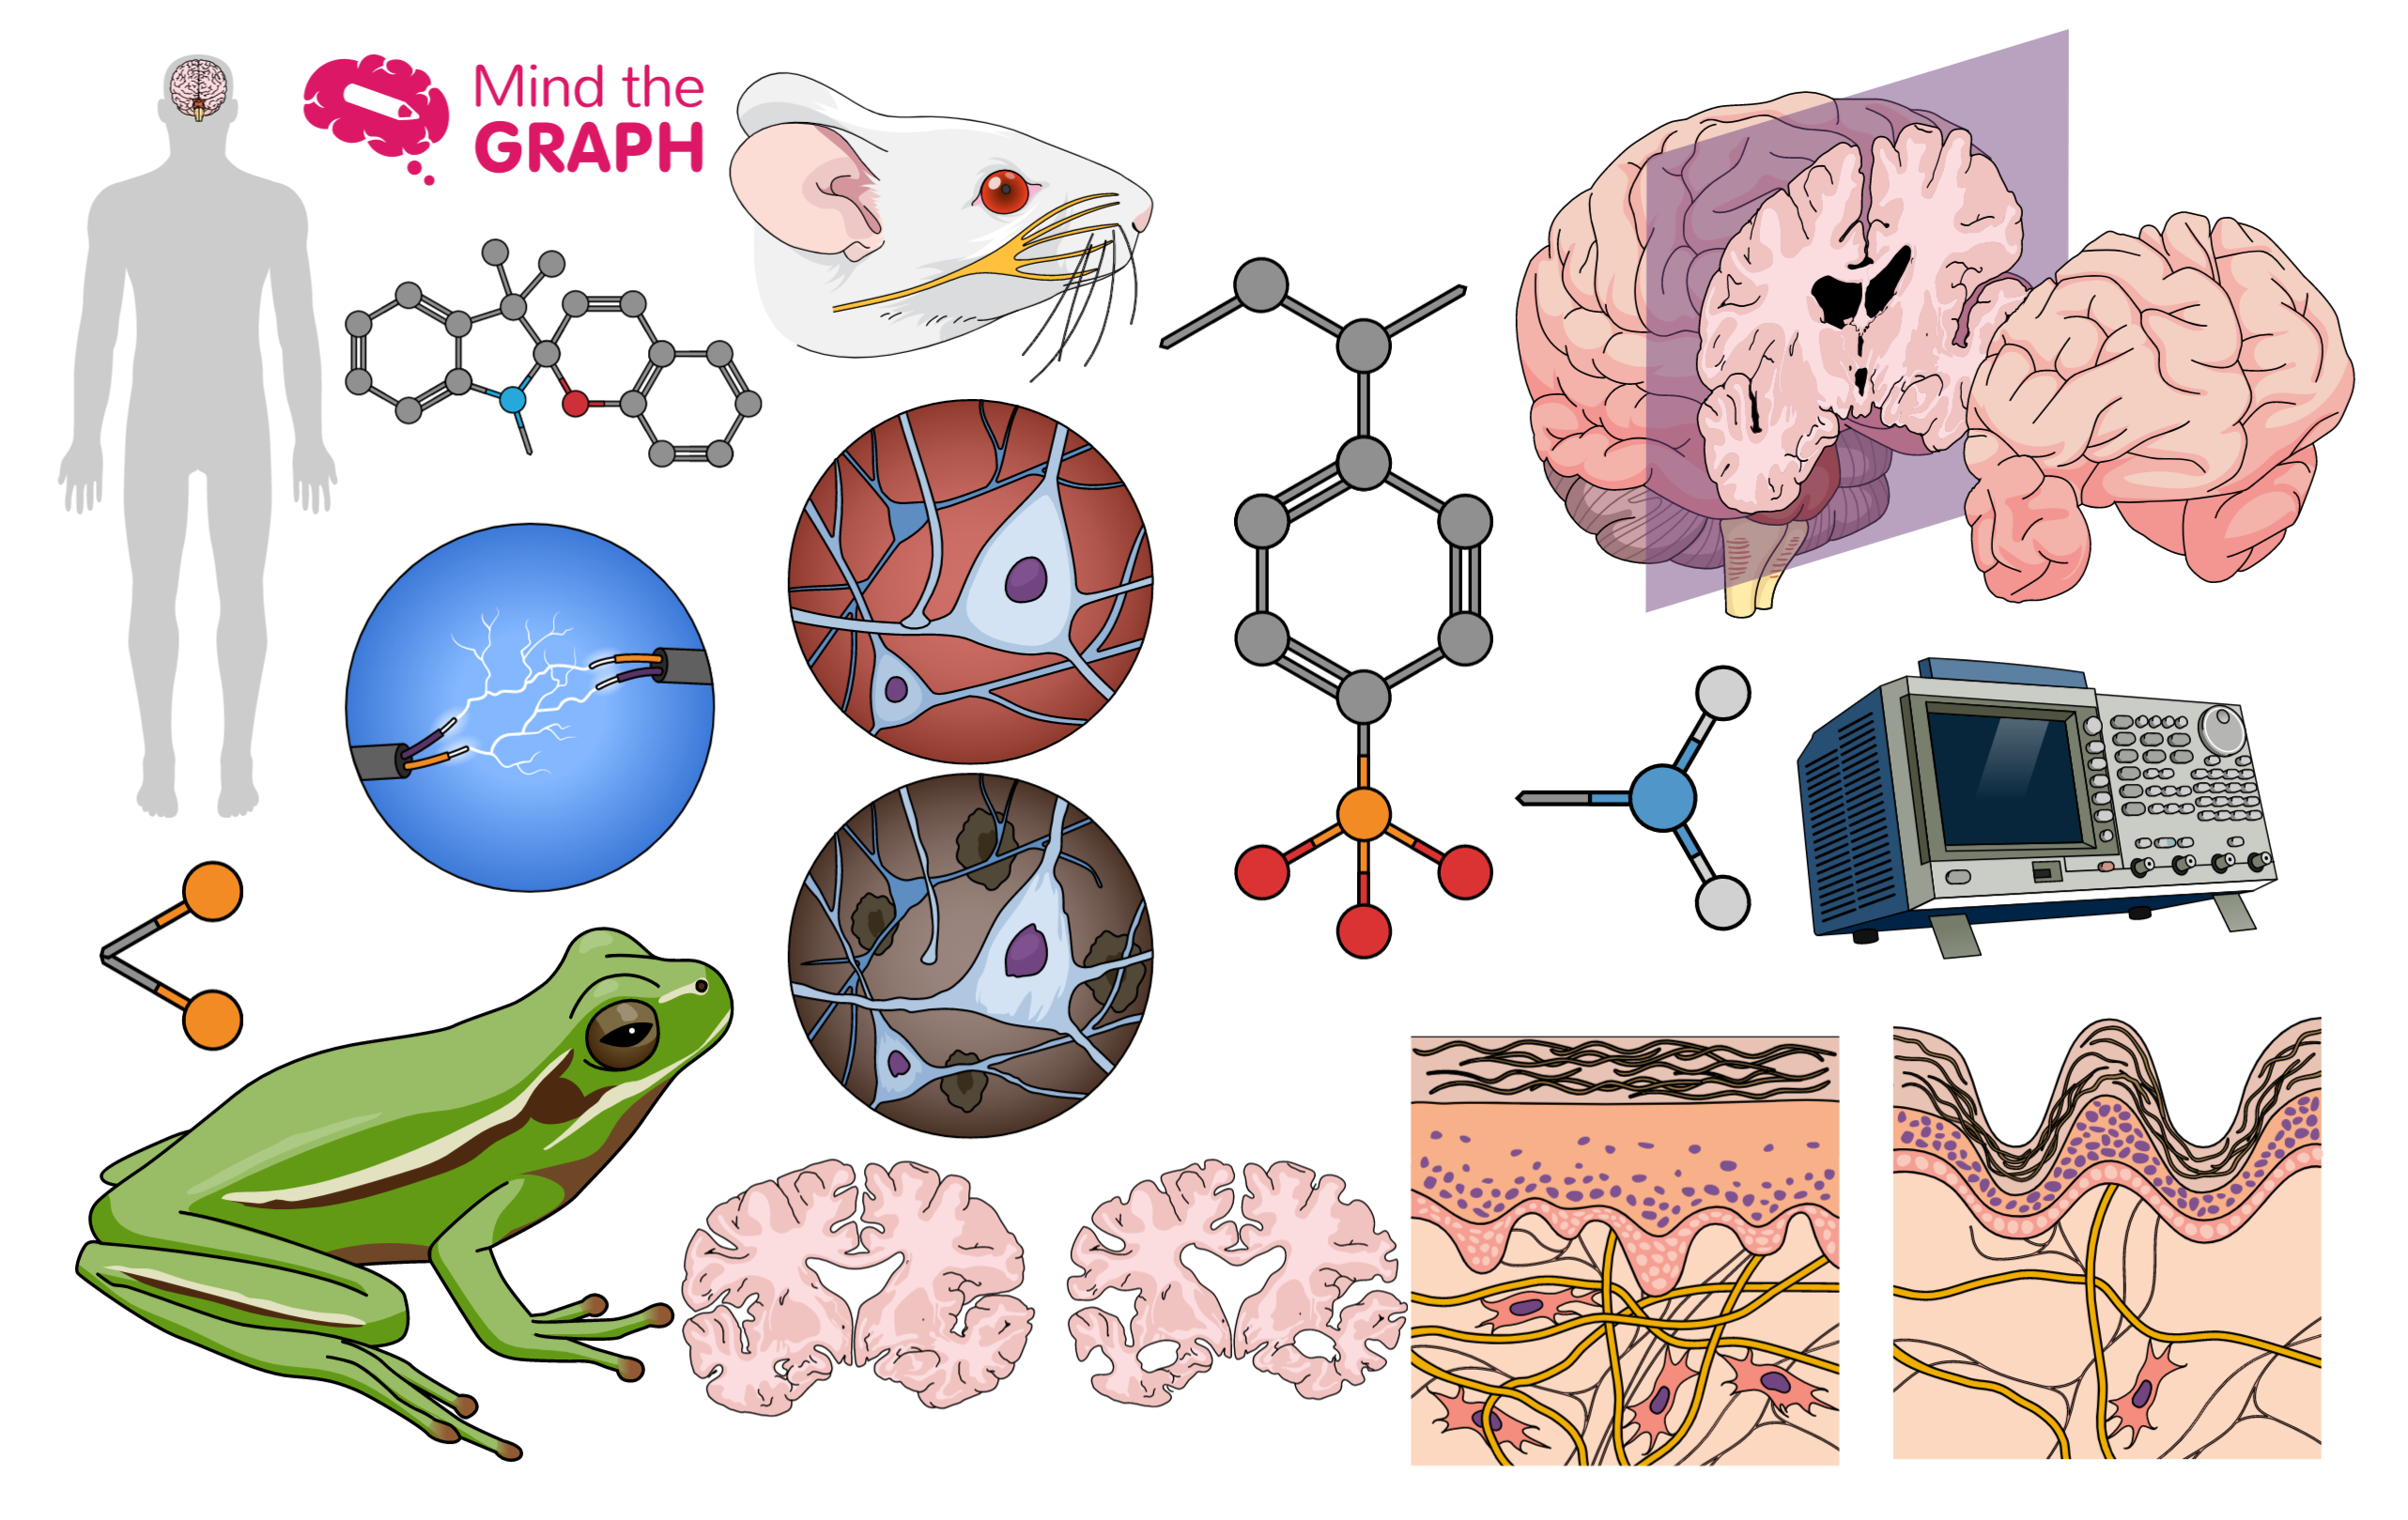
Fredag er dagen vi viser frem våre nye vitenskapelige og medisinske illustrasjoner. Vi har allerede over åtte tusen illustrasjoner i biblioteket vårt som er tilgjengelig for alle mind the graph-brukere (inkludert gratisbrukere). Med disse illustrasjonene kan du lage grafiske sammendrag, infografikk, artikler, plakater, undervisning og hva du måtte ønske. Så hvis du er en mind the [...]
Vitenskapen kan forandre verden. Det betyr at vi som forskere har en enorm makt. [...]
Det er ikke lett å fange og holde på oppmerksomheten til barn og tenåringer. Men [...]
Hvis du er forsker, lege, student eller forsker, vet du at det å holde presentasjoner er [...].
Fredag er dagen da vi viser frem våre nye vitenskapelige og medisinske illustrasjoner som gjør det mulig [...].
Hei, alle sammen! Fredag er en dag for å vise de nye vitenskapelige illustrasjonene. Denne uken har vi lagt til flere [...].
Forklarer du vitenskap og komplekse vitenskapelige emner på en forståelig måte? Det er ikke en [...].
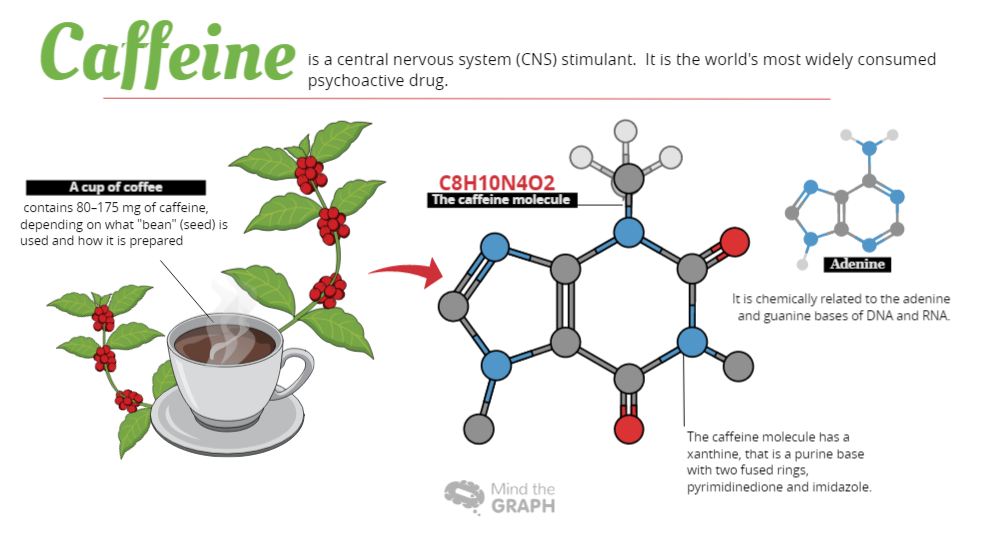
Tok du en kaffe i morges? En del av en forskers sosiale liv er [...].
Hei, det er på tide å vise de nye Mind the Graph vitenskapelige illustrasjonene. Vi har allerede [...]
For å kommunisere vitenskapens betydning i samfunnet må vi først kunne [...].
Como você sabe, todas as sextas-feiras compartilhamos as novas ilustrações que adicionamos no Mind the [...]
Som du sikkert vet, er Mind the Graph en nettbasert plattform som lar forskere [...].
Olá! É sexta-feira novamente (YAY). Você está correndo para o fim de semana? Ou você [...]