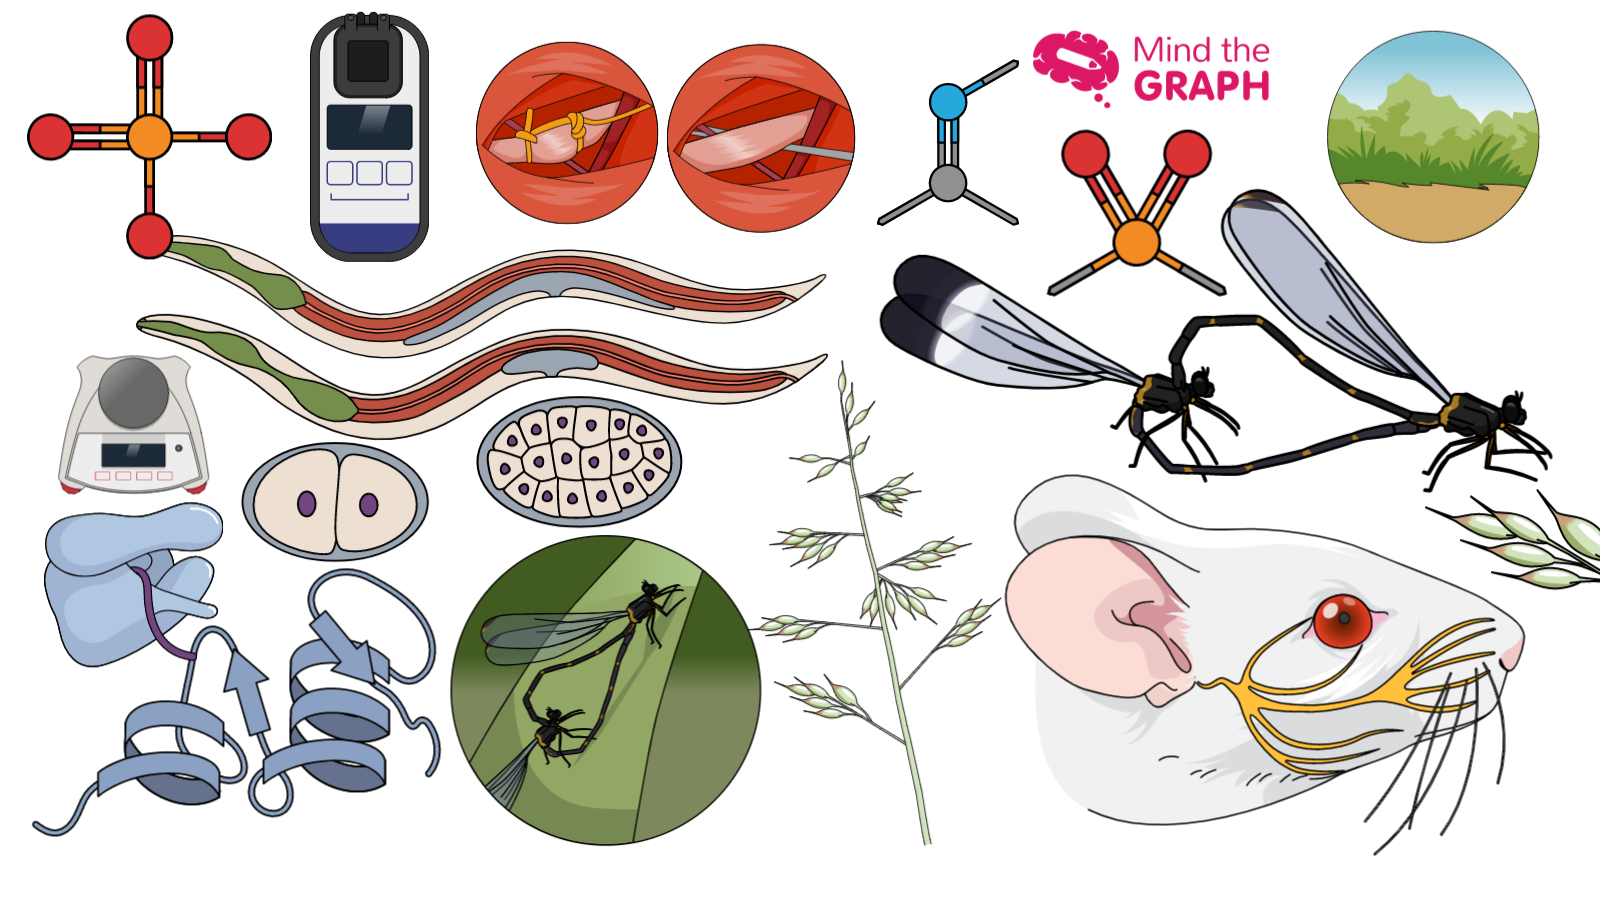
To communicate the importance of science in our society, we need first be able to communicate science in a better and easier way. Sometimes people struggle to understand science because it is hard to visualize. In Chemistry isn’t different. Molecules and chemical bonds aren’t easy to understand and visualize. So, you can use visual resources as scientific illustrations of a chemical structure to explain these topics.
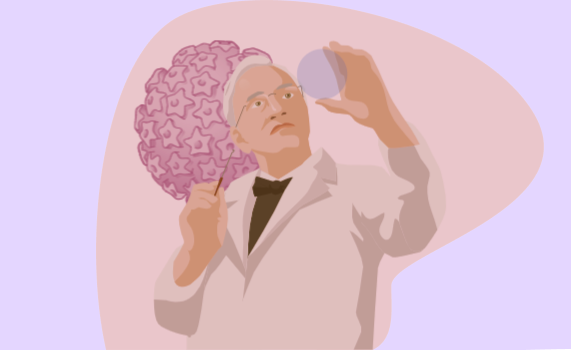
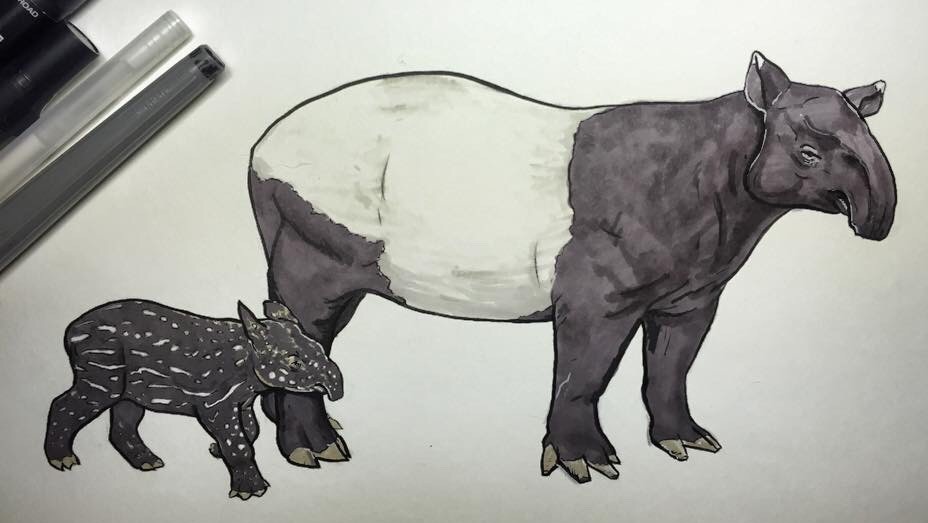
Vitenskapelige illustrasjoner are a powerful tool to communicate better in science. Using illustrations you can create graphical abstracts, posters, presentations, book or magazines covers and anything you can imagine.
Bruke Mind the Graph-illustrasjoner til å forklare en kjemisk struktur
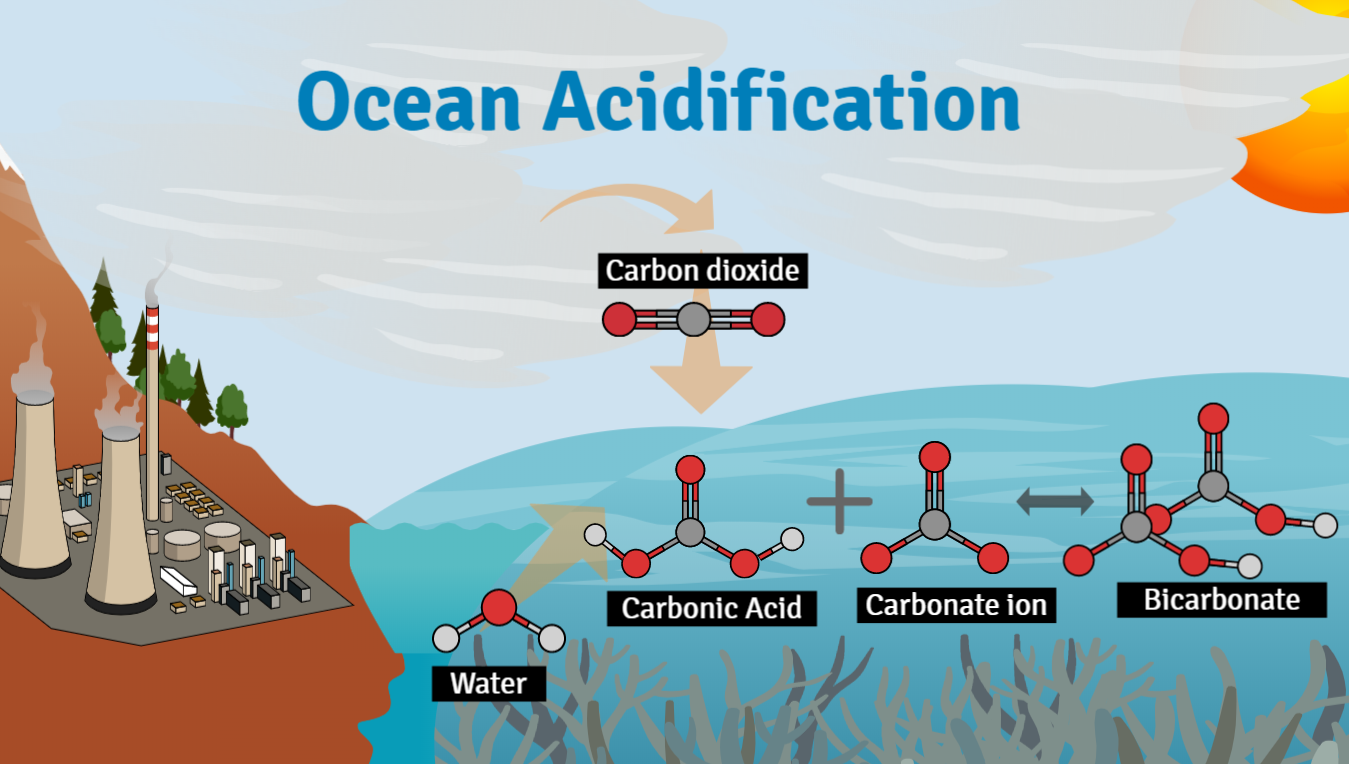
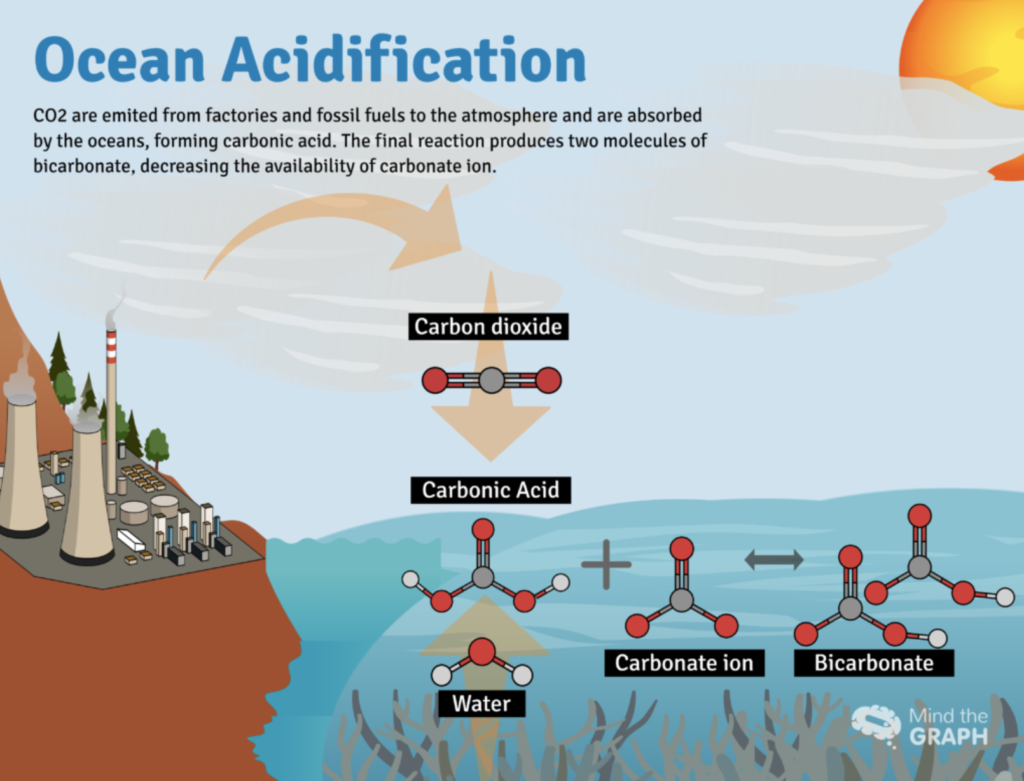
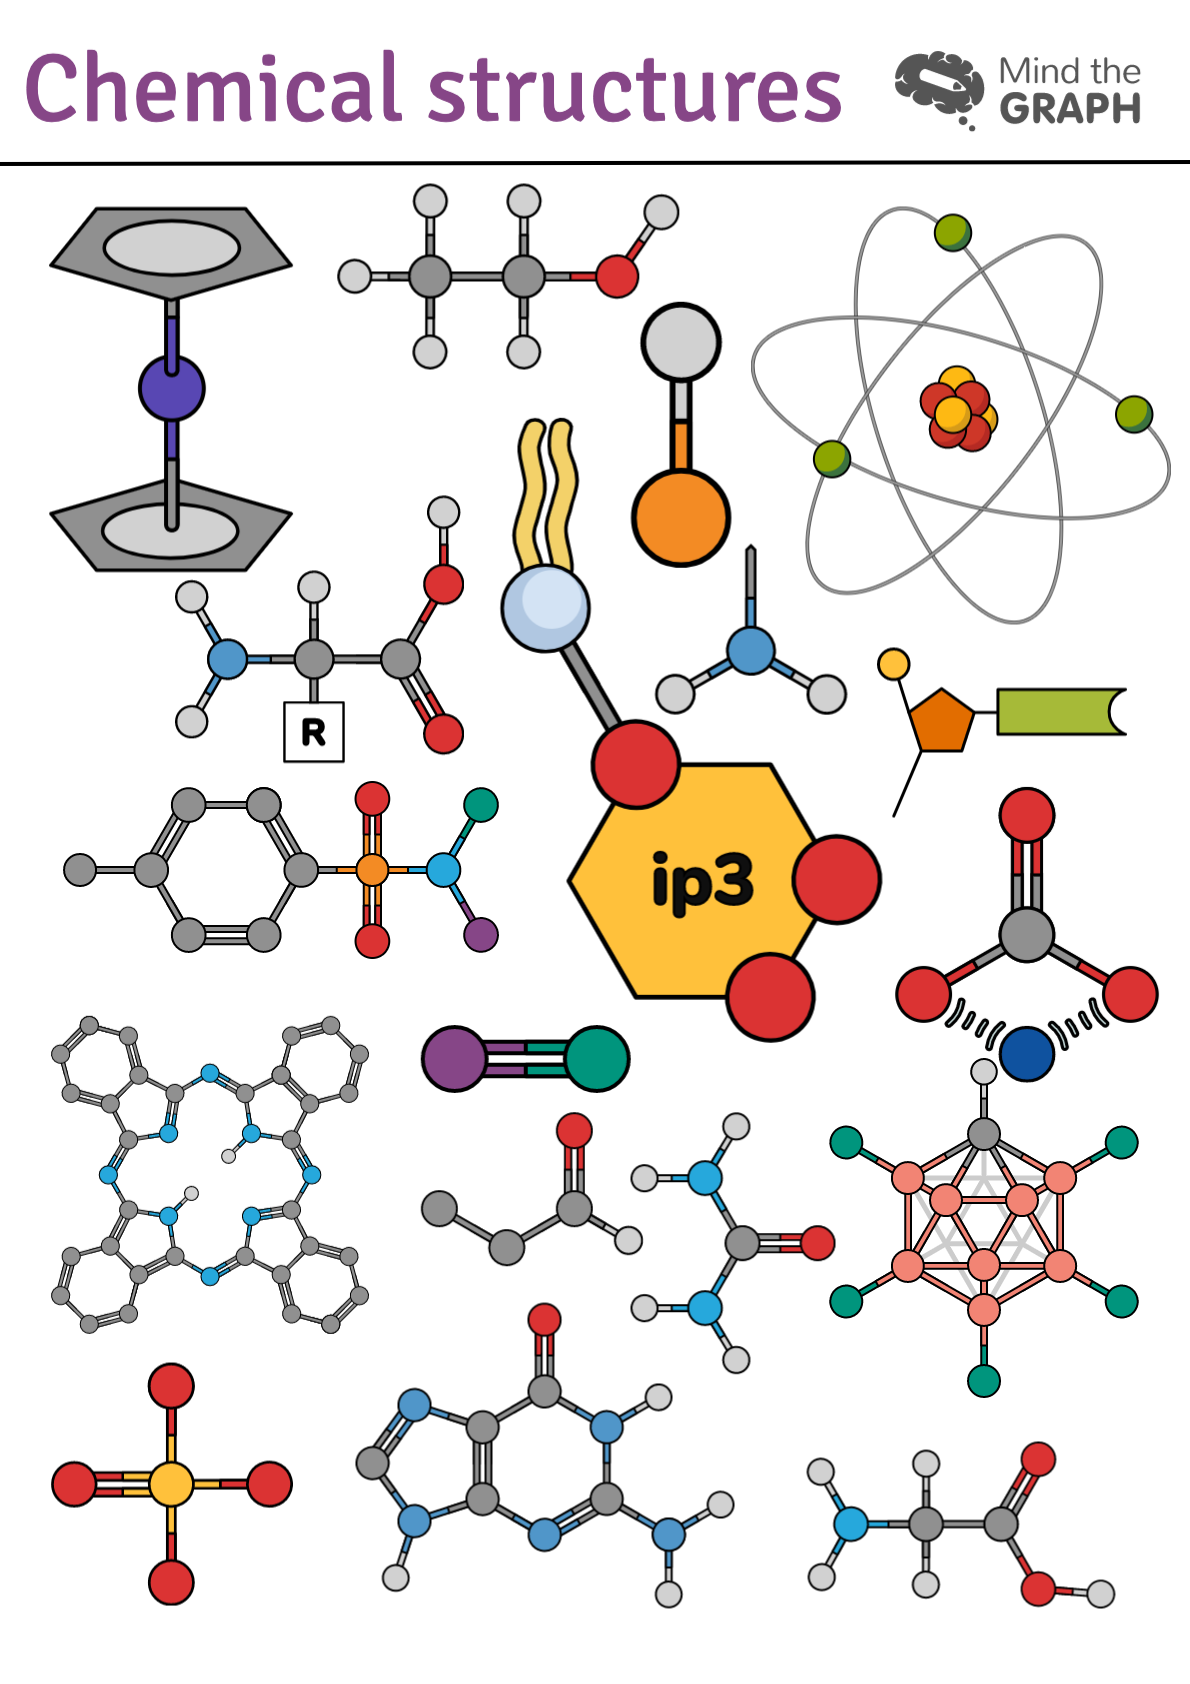
On Mind the Graph we have illustrations that show the chemical structure of molecules. Then, you can combine them to show bonds and interaction between molecules. Our illustrations have a pattern, so you can combine them in an attractive way. Also, each atom has a specific color, so the oxygen is always red, the nitrogen is blue, the calcium is green and so on.
We have over eight thousands of scientific illustrations and hundreds of them are of chemical structures. Take a look in some of them:
You can combine these illustrations with other ones to create your graphical abstract, take a look at this example of ocean acidification created at Mind the Graph:
Hvis du vil bruke disse illustrasjonene eller se de andre, kan du bli med oss! Du kan begynne gratis:

Abonner på nyhetsbrevet vårt
Eksklusivt innhold av høy kvalitet om effektiv visuell
kommunikasjon innen vitenskap.

