The Lancet er et prestisjetungt medisinsk tidsskrift som ble grunnlagt i 1823, og som publiserer artikler med stor gjennomslagskraft innen klinisk medisin, global helse og folkehelse. Blant klinikere, forskere og beslutningstakere over hele verden setter The Lancet standarden for kvalitet og stringens innen medisinsk publisering. The Lancet publiserer artikler som ikke bare bidrar til vitenskapelig kunnskap, men som også påvirker helsepolitikk og praksis over hele verden.
Det er avgjørende å få forskningen din til å skille seg ut i den konkurranseutsatte akademiske publiseringsverdenen. Grafiske sammendrag har blitt et effektivt verktøy for å øke synligheten og gjennomslagskraften til vitenskapelige artikler. Visuelle sammendrag er utformet for raskt å kommunisere de viktigste funnene i studien din til et bredt publikum. Grafiske sammendrag formidler komplekse ideer ved hjelp av bilder, diagrammer og minimalt med tekst, i motsetning til tradisjonelle sammendrag som er teksttunge. I dagens raske digitale miljø gjør denne tilnærmingen arbeidet ditt mer tilgjengelig, engasjerende og minneverdig.
Alle som ønsker å publisere i The Lancet, bør følge de spesifikke retningslinjene for grafiske sammendrag på grunn av The Lancets prestisjefylte status. Denne veiledningen har som mål å gjøre det enklere å lage et grafisk sammendrag som er skreddersydd i henhold til The Lancets standarder. Denne veiledningen tar deg gjennom de viktigste trinnene, fra du utformer sammendraget til du ferdigstiller det for innsending. Følgende retningslinjer vil hjelpe deg med å skrive et overbevisende grafisk sammendrag som oppfyller The Lancets krav og maksimerer forskningens gjennomslagskraft.
Forstå The Lancets krav
For å sikre at forskningen din blir effektivt kommunisert og godt mottatt av The Lancets mangfoldige lesere, er det viktig at du lager et grafisk sammendrag som oppfyller deres standarder. Her finner du en detaljert oversikt over The Lancets spesifikke retningslinjer, nøkkelelementer og tekniske spesifikasjoner.
Spesifikke retningslinjer fra The Lancet for grafiske sammendrag
Lancets grafiske sammendrag legger stor vekt på klarhet og presisjon. Målet er et engasjerende og lett forståelig visuelt sammendrag av forskningen din, som skal appellere til både klinikere, forskere og beslutningstakere. Retningslinjene legger vanligvis vekt på følgende:
- Funksjon og formål: Et grafisk sammendrag skal formidle essensen av forskningen din på en kortfattet måte. Det bør fremheve de viktigste funnene eller det mest kritiske budskapet i studien i et visuelt format. Hold bildet enkelt, og unngå unødvendige detaljer som kan forvirre leseren eller gjøre bildet uoversiktlig.
- Overensstemmelse med manuskriptet: Det grafiske sammendraget skal være i tråd med innholdet og konklusjonene i manuskriptet ditt. Den visuelle fremstillingen må være et troverdig og nøyaktig sammendrag av forskningen din, ikke bare et dekorativt element.
- Overholdelse av etiske standarder: I likhet med tekstlig innhold må det grafiske sammendraget overholde etiske standarder. Som en del av denne prosessen skal innhold fra tredjeparter siteres på riktig måte, data skal presenteres på riktig måte, og plagiering skal unngås.
Viktige elementer som bør inkluderes
For å skape et overbevisende grafisk sammendrag anbefaler The Lancet at man fokuserer på følgende nøkkelelementer:
- Klarhet: Sammendraget skal være enkelt og lett å forstå ved første øyekast. Det skal være åpenbart for leseren hva som er hovedideen, uten at det er nødvendig å lese det tilhørende manuskriptet. Et sammendrag kan være det første og noen ganger det eneste en leser ser, så det er viktig å gjøre sammendraget visuelt tiltalende.
- Relevans: Hvert element i det grafiske sammendraget bør være direkte relatert til de viktigste funnene i forskningen din. Ikke ta med uvedkommende informasjon eller for kompleks grafikk som ikke bidrar til forståelsen av studien.
- Hold det enkelt: Selv om det er fristende å lage et detaljert og forseggjort design, er enkelhet ofte mer effektivt. Hold ikonene enkle, etikettene tydelige og teksten minimal. For å formidle høydepunktene fra forskningen på en enkel måte, bør designet ikke overvelde betrakteren.
- Konsistens: Sørg for at den visuelle stilen er konsekvent gjennom hele abstraktet. Skap et sammenhengende utseende ved å bruke ensartede fargevalg, skriftstiler og oppsett. Denne konsistensen bidrar til å gjøre sammendraget mer profesjonelt og lettere å tolke.
- Vitenskapelig nøyaktighet: Alle visuelle elementer skal representere dataene og funnene på en nøyaktig måte. Grafer, diagrammer eller bilder som brukes, må være vitenskapelig nøyaktige og skalert på riktig måte.
Tekniske spesifikasjoner
Det finnes spesifikke tekniske retningslinjer for grafiske sammendrag i The Lancet for å sikre at de er av høy kvalitet og oppfyller tidsskriftets publiseringsstandarder. Her følger de viktigste tekniske spesifikasjonene du må følge:
- Størrelse og dimensjoner: Det grafiske sammendraget bør vanligvis være 9 cm x 9 cm og passe inn i et enkeltspalteformat. Sjekk imidlertid alltid de nyeste retningslinjene, da disse målene noen ganger kan variere avhengig av tidsskriftets seksjon eller artikkeltype.
- Oppløsning: Publisering av høyoppløselige bilder er avgjørende. Trykte og digitale versjoner av The Lancet må ha en minimumsoppløsning på 300 DPI (punkter per tomme).
- Filformat: TIFF, EPS og høyoppløselig JPEG er de foretrukne filformatene. I tillegg til at disse formatene opprettholder bildekvaliteten, er de kompatible med tidsskriftets publiseringssystem. PNG- og GIF-filer med lav oppløsning bør unngås.
- Fargemodus: Bruk RGB-fargemodellen for alle grafiske sammendrag som skal publiseres på nettet. CMYK-fargemodellen bør brukes hvis sammendraget skal trykkes. Fargene bør være distinkte og lette å skille fra hverandre, spesielt for personer med nedsatt fargesyn.
- Tekst og skrifttype: Teksten i det grafiske sammendraget skal være leselig når du ser på det med 100% zoom. Hvis sammendraget publiseres i redusert størrelse, bør du bruke en skrifttype uten seriffer, for eksempel Arial eller Helvetica. Hold teksten på et minimum for å unngå rot.
Ved å følge disse retningslinjene sikrer du at det grafiske sammendraget ditt er visuelt tiltalende og i samsvar med The Lancets standarder, noe som øker sannsynligheten for at forskningen din får gjennomslagskraft.
Konseptualisering av det grafiske sammendraget
Identifiser hovedbudskapet i forskningen din
For at et grafisk sammendrag skal være vellykket, må det formidle hovedbudskapet i forskningen på en klar og konsis måte. En eller to setninger bør oppsummere de viktigste funnene eller konklusjonene i studien din. Et hovedbudskap kan for eksempel være oppdagelsen av en ny biomarkør for tidlig oppdagelse av sykdom. Forskningen din bør være ny, betydningsfull og ha gjennomslagskraft. Det er viktig at det grafiske sammendraget ditt formidler dette budskapet på et øyeblikk, slik at leserne er klar over hva studien din tilfører feltet.
Brainstorm visuelle metaforer eller konsepter
Når du har bestemt deg for hovedbudskapet ditt, bør du tenke på hvordan du skal formidle det visuelt. Ved å bruke visuelle metaforer kan komplekse ideer oversettes til enkle, lett forståelige bilder. En sommerfugl som kommer ut av puppen, kan være et passende bilde for forskningen din som handler om forvandling. For å illustrere spredningen av en sykdom kan du bruke et forgrenet tre eller et nettverk.
Ta hensyn til abstrakte representasjoner som er i tråd med forskningen din. Bruk av piler kan indikere retning eller endring, bruk av sirkler kan indikere sykluser eller fullstendighet, og bruk av rutenett kan vise data eller struktur. Bruk visuelle virkemidler som er relatert til funnene dine, og som er enkle å forstå. Skiss opp noen ideer, selv om de er grove. Denne innledende idémyldringsfasen handler om å utforske ulike måter å kommunisere forskningen din visuelt på, så ikke vær redd for å være kreativ.
Ha målgruppen i tankene
The Lancet har både klinikere, forskere og beslutningstakere blant sine lesere. Tenk over hva som vil vekke mest gjenklang hos disse gruppene når du utformer det grafiske sammendraget ditt. De metodologiske eller vitenskapelige nyvinningene i arbeidet ditt kan være mer interessante for forskere enn klare, direkte bilder som viser klinisk relevans. Implikasjonene for folkehelsen eller de bredere implikasjonene kan være av interesse for beslutningstakere.
Du bør skreddersy det grafiske sammendraget slik at det fremhever de aspektene ved forskningen din som vil være mest meningsfulle for målgruppen. Tenk på de praktiske resultatene av studien din hvis den har umiddelbare kliniske anvendelser. Fokuser på bredere implikasjoner og potensielle endringer som følge av forskningen din hvis den bidrar til politiske diskusjoner.
Ikke bruk altfor teknisk sjargong eller kompliserte bilder som kan virke fremmedgjørende på ikke-spesialister. Det er viktig å gjøre forskningen tilgjengelig og engasjerende for så mange som mulig, uten at det går på bekostning av nøyaktighet eller detaljer.
Grafisk abstrakt kan ses på flere måter, så hvis du vil forstå det i detalj, kan du lese blogginnlegget vårt "Hva er et grafisk abstrakt?“.
Utforming av det grafiske sammendraget
Velge de riktige verktøyene
De riktige verktøyene kan drastisk forbedre kvaliteten og effektiviteten i designprosessen når du skal lage et grafisk sammendrag til The Lancet. Vi anbefaler følgende programvare og verktøy:
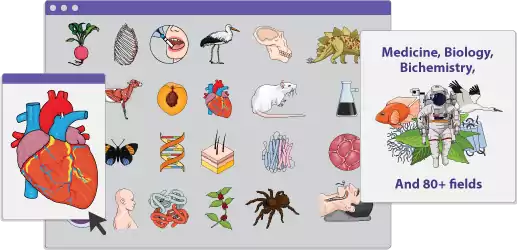
- Mind the Graph: Dette verktøyet er spesielt utviklet for forskere som har behov for å lage vitenskapelige illustrasjoner. Det tilbyr en rekke tilpassbare maler og vitenskapelige ikoner som gjør det enklere å produsere grafiske sammendrag av høy kvalitet som effektivt kommuniserer kompleks informasjon.
- Adobe Illustrator: Adobe Illustrator er et profesjonelt redigeringsprogram for vektorgrafikk som gir uovertruffen kontroll over alle aspekter av designet. Høyoppløselige, detaljerte grafiske abstrakter som krever presisjon, lages best med dette programmet. Selv om det er enklere å lære seg, passer det bedre for dem som har litt designerfaring.
- Canva: Canva er et brukervennlig, nettbasert designverktøy som tilbyr et bredt utvalg av maler og designelementer. Selv om du ikke har omfattende designerfaring, er det et godt valg for deg som ønsker å skape et polert, profesjonelt grafisk abstrakt. Du kan eksperimentere med ulike layouter og stiler ved hjelp av Canvas dra-og-slipp-grensesnitt.
- BioRender: BioRender er et verktøy som er utviklet spesielt for biovitenskap, og tilbyr ferdiglagde vitenskapelige ikoner og maler. Det er spesielt nyttig for medisinsk og biologisk forskning, ettersom det forenkler prosessen med å lage grafikk som både er nøyaktig og visuelt tiltalende.
Tips om å bruke maler eller starte fra bunnen av
- Bruke maler: Hvis du er ny innen design eller har dårlig tid, kan det å starte med en mal være en god måte å sikre at det grafiske sammendraget ditt er visuelt balansert og følger beste praksis for design. Du kan tilpasse maler i de fleste forskningsverktøy, for eksempel Canva og BioRender. Det er viktig at malen du velger, er i tråd med The Lancets retningslinjer og forskningsfokuset ditt.
- Begynner helt fra bunnen av: For de som har mer designerfaring eller spesifikke behov som ikke dekkes av maler, gir det full kreativ frihet å lage det grafiske sammendraget fra bunnen av. I denne prosessen er det viktig å opprettholde en klar struktur, slik at designet ditt formidler hovedbudskapet i forskningen din uten å overvelde betrakteren.
Utforming av en visuell fortelling
Grafiske sammendrag er mer enn bare bilder og tekst; de er visuelle fortellinger som guider betrakteren gjennom forskningsresultatene dine. En visuell fortelling kan utformes på følgende måter:
Bruk av farger, former og symboler
- Farge: Bruk farger strategisk for å fremheve de mest kritiske aspektene ved forskningen din. Mens kontrastfarger kan trekke oppmerksomheten mot viktige funn, kan konsistente fargevalg bidra til å skille mellom ulike seksjoner eller prosesser. Ikke overless designet med farger, da dette kan få det til å virke rotete.
- Former og symboler: Former og symboler kan være effektive verktøy for å formidle komplekse ideer på en kortfattet måte. En pil kan indikere en sykdoms kausalitetsretning, mens en sirkel kan representere en syklus eller prosess. Publikum bør forstå og sette pris på symboler som er universelt forståelige.
Balanse mellom tekst og bilder
- Tekst: Selv om bildene er hovedfokuset i et grafisk sammendrag, spiller teksten en avgjørende rolle når det gjelder å tydeliggjøre og forsterke det visuelle budskapet. Når du merker diagrammer eller fremhever viktige funn, bør du bruke et kortfattet og klart språk. Bruk kulepunkter og korte setninger i stedet for lange avsnitt.
- Bilder: Bildene i det grafiske sammendraget bør fungere i harmoni med teksten for å fortelle en sammenhengende historie. Enten du illustrerer en prosess, viser data eller gir kontekst, må du sørge for at bildene er direkte relatert til forskningen din.
Sikre lesbarhet og tilgjengelighet
- Valg av skrifttype: Velg skrifttyper som er lette å lese i ulike størrelser. Mange foretrekker sans-serif-fonter som Arial eller Helvetica på grunn av deres klarhet. Det er best å unngå dekorative fonter som kan være vanskelige å lese.
- Tilgjengelighet: Tenk over hvordan det grafiske sammendraget ditt vil bli sett på ulike enheter og av ulike målgrupper. Fargekontrasten bør være sterk nok til at seere som er fargeblinde, og teksten bør være stor nok til at den kan leses på små skjermer. Lesere med nedsatt syn kan også ha nytte av alt-tekstbeskrivelser for bilder.
Vanlige fallgruver å unngå
Til tross for at du gjør ditt beste, er det en rekke vanlige feil du kan gjøre som undergraver effektiviteten til det grafiske sammendraget. Se opp for disse fallgruvene:
- Overkomplisering av designet
Et uoversiktlig og forvirrende grafisk sammendrag kan bli resultatet av å inkludere alle detaljer i forskningen din. Vær tydelig og grei i presentasjonen av de viktigste funnene. Det er viktig å huske på at målet er å tiltrekke seg lesernes oppmerksomhet, ikke å overvelde dem.
- Uoverensstemmelse med forskningsbudskapet
Hovedbudskapet i forskningen din bør visualiseres i det grafiske sammendraget. Når designet ikke samsvarer med funnene dine, kan det skape forvirring og redusere gjennomslagskraften. Før du ferdigstiller designet, bør du forsikre deg om at alle elementene i designet bidrar til en sammenhengende fortelling som gjenspeiler forskningen du har gjort, på en presis måte.
- Ignorerer The Lancets retningslinjer
I tillegg til retningslinjer for størrelse og format stiller The Lancet også spesifikke innholdskrav til grafiske sammendrag. Hvis du ikke overholder disse retningslinjene, kan det føre til at sammendraget ditt blir avvist eller må revideres i betydelig grad. Sørg for at det endelige produktet ditt oppfyller The Lancets krav før du starter designprosessen.
Når du velger verktøyene dine med omhu, lager en gjennomtenkt visuell fortelling og unngår vanlige fallgruver, vil det grafiske sammendraget ditt ikke bare oppfylle The Lancets standarder, men også øke forskningens synlighet og gjennomslagskraft.
Ferdigstilling av det grafiske sammendraget
Det er viktig å sørge for at det grafiske sammendraget ditt oppfyller alle nødvendige standarder før du sender det inn. Ved å gå grundig gjennom arbeidet ditt kan du unngå vanlige feil og forbedre kvaliteten. Her er en sjekkliste som kan hjelpe deg i gjennomgangsprosessen:
- Klarhet: Sørg for at kjernebudskapet i forskningen din kommuniseres tydelig. Unngå unødvendig sjargong eller komplisert terminologi. Sørg for at det visuelle materialet er lett å forstå og at presentasjonen er tydelig.
- Tilpasning til forskning: Kontroller at det grafiske sammendraget gjenspeiler de viktigste funnene og målene for forskningen din. Du bør sørge for at alle grafiske elementer (symboler, ikoner, tekst) er direkte relatert til studien din. Forskningsartikler bør ikke introdusere ny informasjon i sammendragene som ikke er dekket i dem.
- Overholdelse av retningslinjer: Gå gjennom The Lancets spesifikke retningslinjer for grafiske sammendrag, inkludert dimensjoner, filformat og oppløsning. Følg The Lancets stil og tone når du skriver sammendraget. Kontroller at størrelsen og skrifttypen på eventuelle tekstelementer er i samsvar med Lancets retningslinjer.
Søker tilbakemelding
Når du er ferdig med gjennomgangen, er det viktig å søke tilbakemelding fra andre som kan bidra med nye perspektiver:
- Kolleger og likemenn: Del det grafiske sammendraget med kolleger som kjenner til forskningen din, for å få deres innspill. Be dem identifisere områder der budskapet kan være uklart, eller der designet kan forbedres. Det kan være nødvendig å revidere de visuelle elementene hvis deres tolkninger ikke stemmer overens med intensjonene dine.
- Designeksperter: Hvis det er mulig, bør du rådføre deg med en designekspert eller noen med erfaring i å lage grafiske abstrakter. Sammen kan dere diskutere fargevalg, layout og visuell balanse. Abstraktet ditt kan også forbedres ved at en designer påpeker feil i designet eller foreslår bedre måter å formidle budskapet ditt på.
- Målgruppe: Få tilbakemelding fra personer som representerer målgruppen for forskningen din (f.eks. klinikere, forskere, beslutningstakere). Sammendraget bør være engasjerende og lett å forstå, ettersom deres perspektiv er avgjørende for at du skal lykkes.
Gjør endringer basert på tilbakemeldinger
Når du har samlet inn tilbakemeldinger, er det på tide å gjøre de nødvendige revisjonene:
- Fokuser på de mest kritiske tilbakemeldingene som har direkte innvirkning på det grafiske sammendragets klarhet og nøyaktighet. Prioriter endringer som forbedrer formidlingen av forskningsresultatene dine, fremfor forslag til designforbedringer.
- Foredle de visuelle elementene basert på mottatte tilbakemeldinger. Sørg for at alle revisjoner er i tråd med The Lancets retningslinjer, og at det overordnede designet forblir sammenhengende.
- Sørg for at sammendraget fortsatt formidler forskningen din på en effektiv måte etter at du har gjort endringer, ved å gå gjennom sjekklisten for klarhet. For å få bekreftet at revisjonene har forbedret sammendraget, bør du vurdere å be om en ny runde med tilbakemeldinger.
Endelig samsvarskontroll
Sørg for at det grafiske sammendraget ditt er i samsvar med The Lancets retningslinjer. Sørg for at sammendraget er klart for innsending ved å sjekke filformat, oppløsning og dimensjoner. Du vil øke den samlede effekten av publikasjonen din i The Lancet betydelig hvis du ferdigstiller det grafiske sammendraget med nøye gjennomgang og tilbakemelding.
Innsending til The Lancet
Slik sender du inn et grafisk sammendrag sammen med manuskriptet ditt
Du kan øke synligheten og gjennomslagskraften til forskningen din betydelig ved å inkludere et godt utformet grafisk sammendrag når du sender inn et manuskript til The Lancet. Følg disse trinnene for å sikre at det grafiske sammendraget ditt er korrekt innsendt:
- Forbered filene dine: Sørg for at det grafiske sammendraget oppfyller The Lancets tekniske krav, inkludert format (vanligvis JPEG, PNG eller TIFF), oppløsning (vanligvis 300 dpi) og dimensjoner. Sørg for at hovedbudskapet i manuskriptet ditt formidles i det grafiske sammendraget.
- Innlemme det grafiske sammendraget i innsendingssystemet: The Lancets elektroniske innsendingssystem gjør det mulig å laste opp tilleggsfiler, inkludert grafiske sammendrag. Du vil bli bedt om å laste opp flere filer under innsendingsprosessen - det er her det grafiske sammendraget ditt skal inkluderes. Tittelen skal være tydelig merket (f.eks. "Graphical Abstract").
- Gi en kort beskrivelse: Noen innsendingssystemer krever en kort beskrivelse av det grafiske sammendraget. Beskriv forskningen din i en kortfattet bildetekst eller forklaring som utfyller sammendraget.
- Innlevering av anmeldelse: Før du fullfører innsendingen, må du gå gjennom alle opplastede filer, inkludert det grafiske sammendraget, for å sikre at de er riktig vedlagt og formatert. Dette er avgjørende for å unngå tekniske feil eller innsendingsfeil.
Vanlige problemer under innsending og hvordan du unngår dem
Det kan være en møysommelig prosess å sende inn et grafisk sammendrag til et prestisjetungt tidsskrift som The Lancet, og det kan oppstå flere problemer i forbindelse med innsending av sammendraget:
- Feil i filformatet: Sørg for at det grafiske sammendraget ditt er i riktig filformat og oppfyller kravene til oppløsning og størrelse som er spesifisert av The Lancet. Hvis du bruker feil format (f.eks. et bilde med lav oppløsning), kan det føre til avvisning eller innsending på nytt.
- Manglende samsvar med manuskriptets innhold: Et grafisk sammendrag som ikke gir en tydelig fremstilling av funnene i manuskriptet, kan forvirre anmeldere og lesere. Sørg for at det grafiske sammendraget fanger opp de viktigste poengene i manuskriptet og oppsummerer forskningen på en effektiv måte.
- Overbelastning av det visuelle: Unngå å stappe for mye informasjon inn i det grafiske sammendraget. Et rotete eller altfor komplekst oppsett kan undergrave effektiviteten til et design. Ikke gå bort fra hovedpoenget, og forenkle så mye som mulig.
- Tekniske problemer i innleveringssystemet: Av og til kan innsendingsplattformer ha tekniske problemer, noe som kan føre til mislykkede opplastinger eller ødelagte filer. Ta sikkerhetskopier av alle filer og sørg for at internettforbindelsen din er stabil for å unngå dette. Du kan kontakte tidsskriftets supportteam for å få hjelp hvis du støter på vedvarende problemer.
Viktigheten av å følge opp innsendingen din
Etter at du har sendt inn manuskriptet og det grafiske sammendraget, er det viktig å være proaktiv:
- Status for innsending av spor: Sjekk regelmessig status for innsendingen din via The Lancets innsendingsportal. Det er viktig å holde oversikt over eventuelle oppdateringer eller forespørsler om endringer, slik at du kan svare raskt og holde vurderingsprosessen i gang.
- Håndtere tilbakemeldinger: Hvis redaksjonen ber om endringer i det grafiske sammendraget, må du svare raskt og nøyaktig på tilbakemeldingene. Et forsinket eller ufullstendig svar kan forsinke publiseringsprosessen.
- Bekreftelse av aksept: Når manuskriptet og det grafiske sammendraget ditt er akseptert, mottar du en bekreftelse på e-post. Sørg for at alle opplysningene om godkjenningen, inkludert det grafiske sammendraget, er korrekte.
- Engasjer deg i markedsføring etter publisering: Etter publisering bør du aktivt promotere forskningen din og det grafiske sammendraget gjennom sosiale medier, akademiske nettverk og konferanser. Arbeidet ditt kan få større rekkevidde og gjennomslagskraft hvis du engasjerer deg med publikum etter publisering.
Hvis du følger disse trinnene, vil det grafiske sammendraget ditt bidra positivt til manuskriptets samlede gjennomslagskraft i The Lancet.
Visualiser forskningsartikler på en engasjerende måte
Engasjer publikum med visuelt tiltalende bilder som er utviklet på grunnlag av forskningen din, slik at du sparer tid og fanger oppmerksomheten deres. Enten det dreier seg om intrikate datasett eller komplekse konsepter, Mind the Graph gir deg muligheten til å lage engasjerende infografikk. Med vår intuitive plattform kan du raskt lage flotte bilder som kommuniserer ideene dine på en effektiv måte. Vårt team av eksperter er tilgjengelig for å gi deg støtte og veiledning om nødvendig. Begynn å skape i dag, og gjør et varig inntrykk. Besøk vår nettsted for mer informasjon.

Abonner på nyhetsbrevet vårt
Eksklusivt innhold av høy kvalitet om effektiv visuell
kommunikasjon innen vitenskap.

