Figure description examples are essential tools for presenting complex data and highlighting key insights, but their true value depends on how clearly they are described. Without a well-constructed explanation, even the most insightful figure can be easily misunderstood or overlooked. This article explores the importance of figure description and why it is crucial for turning visual data into meaningful, accessible information.
The primary goal of describing a figure is to communicate its message clearly and effectively. A strong description not only identifies what the figure shows but also places it in context, explaining the significance of the data and drawing attention to important patterns or trends. This approach ensures that the figure becomes more than just a visual aid—it becomes an integral part of the broader analysis or research, supporting accurate interpretation and decision-making. Proper figure descriptions help bridge the gap between visuals and insights, allowing the data to fully inform and engage its audience.
Elementer i en figurbeskrivelse Eksempel
En godt utformet figurbeskrivelse, eller figurforklaring, is essential for helping readers fully understand the data or concepts conveyed visually. It should begin with a clear overview that outlines the figure’s main purpose and relevance. Following this, provide a detailed explanation of the figure’s components, including data points, labels, and any symbols or colors used. Contextualizing the figure within the broader narrative of the research or discussion helps readers understand its significance and relevance.
Hvis figuren skal illustrere en forskningsartikkel, bør beskrivelsen utformes med presisjon for å sikre klarhet og fullstendighet. For ytterligere veiledning, se denne artikkelen: https://mindthegraph.com/blog/how-to-include-figures-in-a-research-paper/
Beskrivelsen bør fremheve bemerkelsesverdige mønstre, trender eller avvik for å avdekke underliggende innsikt. Diskuter implikasjonene av disse funnene, og forklar hvordan de bidrar til forståelsen av temaet eller støtter konklusjonene. Ta med eventuelle spesielle hensyn i tolkningen av figuren, for eksempel at den bør sees i sammenheng med andre data eller visuelle hjelpemidler. Ved å inkludere disse elementene sikrer en grundig figurbeskrivelse en nøyaktig tolkning og forbedrer den generelle forståelsen av den visuelle informasjonen.

Tittel
Provide a clear and concise title for the figure: Tittelen bør beskrive hva figuren handler om uten å være altfor kompleks. Den må sammenfatte hovedpoenget eller det figuren illustrerer.
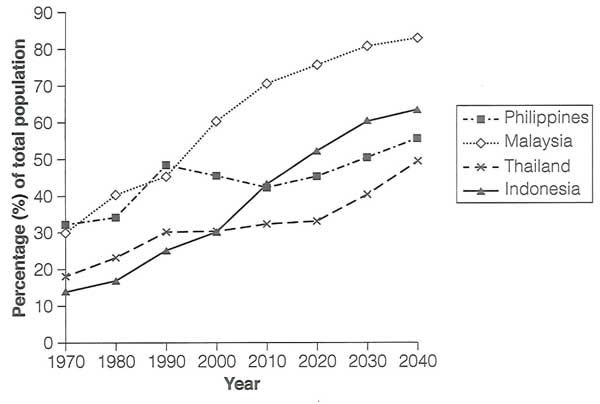
Eksempel: “Urbanization Trends in Four Southeast Asian Countries (1970-2040)”
Sørg for at tittelen gjenspeiler innholdet i figuren: Tittelen sier tydelig at figuren viser prosentandelen av befolkningen som bor i urbane områder i fire sørøstasiatiske land fra 1970 til 2040.
Kontekst
Forklar figurens relevans i et større verk eller en større studie: Beskrivelsen bør klargjøre hvorfor figuren er viktig for det overordnede argumentet, funnene eller budskapet i forskningen eller presentasjonen. Dette hjelper publikum med å forstå de bredere implikasjonene av det visuelle.
Eksempel: “This figure illustrates the percentage of the population living in urban areas in four Southeast Asian countries—Philippines, Malaysia, Thailand, and Indonesia—over a period of 70 years. The data is crucial for understanding regional urbanization patterns and how different countries have adapted to rapid urban growth.
Gi all nødvendig bakgrunnsinformasjon: Some figures require context that is not immediately obvious. You may need to explain the setting of an experiment, the period covered, or why a particular dataset was used.
Eksempel: “The figure is part of a larger analysis on demographic changes in Southeast Asia. It highlights the impact of industrialization, economic development, and population policies on urbanization in these countries.”
Visuelle elementer
Liste opp og beskrive hvert element i figuren (f.eks. akser, linjer, former): A thorough description includes all the important visual elements of the figure, such as the axes (in graphs), types of lines (e.g., solid or dashed), shapes, and how these elements are arranged.
Eksempel: “The x-axis represents the years from 1970 to 2040, while the y-axis represents the percentage of the total population living in urban areas. Four lines represent different countries: a dashed line with squares for the Philippines, a dotted line with diamonds for Malaysia, a dashed line with crosses for Thailand, and a solid line with triangles for Indonesia.”

Nevn fargene som brukes og betydningen av dem: Colors often convey critical meaning, so it is important to describe their use and significance, especially if they indicate categories, trends, or specific variables. When the figure is in black and white, describe the use of different patterns or shading instead of colors.
Generelle retningslinjer for beskrivelse av figurer
Kortfattethet er nøkkelen: Forsøk å holde beskrivelsen kortfattet, og fokuser på de viktigste aspektene ved figuren. Målet er å formidle viktig informasjon på en tydelig måte uten unødvendige detaljer.
Innhold og funksjon: Vurder hva figuren viser og hvilken rolle den spiller i den overordnede diskusjonen. Fokuser beskrivelsen på ny innsikt eller nøkkelinformasjon som figuren gir, og som ikke er dekket i hovedteksten.
Tittel: Begynn med en tydelig og kortfattet tittel eller en oppsummerende setning på mindre enn 125 tegn. Dette gir en umiddelbar forståelse av hva figuren handler om.
Detaljering: Begynn med en generell oversikt, og gå gradvis over til mer spesifikke detaljer. Dette bidrar til å strukturere beskrivelsen på en logisk måte og gjør den lettere å følge for leseren.
Konsistens: Bruk samme stil og terminologi som hovedteksten for å opprettholde sammenhengen. Dette sikrer at figurbeskrivelsen integreres sømløst med resten av innholdet.
Unngå redundans: Ikke gjenta informasjon som allerede er dekket i hovedteksten. Figurbeskrivelsen skal utfylle og forbedre teksten, ikke duplisere den.
Billedtekstplassering: Hvis figuren har en bildetekst, må du sørge for at den ikke er en del av selve bildet og ikke gjentar beskrivelsen. Hvis bildeteksten er inne i bildet, bør du starte beskrivelsen med bildeteksten for å unngå redundans.
Clarity in Abbreviations and Symbols: Skriv ut alle forkortelser og symboler som brukes i figuren. Dette sikrer at alle lesere forstår informasjonen uten å måtte gå tilbake til hovedteksten.
Hensyn til farge: Nevn farger bare hvis det er avgjørende for forståelsen av figuren, eller hvis fargene er referert til i teksten. Unngå å diskutere farger med mindre de spiller en viktig rolle i formidlingen av informasjon.
Disse retningslinjene hjelper deg med å lage tydelige og effektive figurbeskrivelser som øker forståelsen og utfyller hovedteksten, og som gjør komplekse data mer tilgjengelige og informative.
In this article, you can explore when to use a table versus a figure with “Table versus Figure: Learn When To Use Each Of Them” at: https://mindthegraph.com/blog/table-versus-figure/
Tolkning og analyse
Interpreting and analyzing a figure is the process of turning raw data into meaningful insights. Interpretation involves explaining what the figure represents and how it fits within the broader context of the research or discussion. This step is essential because it guides the audience in understanding the figure’s purpose and what it aims to illustrate.
Analysen går et skritt videre ved å undersøke dataene i figuren for å identifisere viktige elementer, for eksempel sammenhenger mellom variabler, endringer over tid eller sammenligninger mellom grupper. Det hjelper leseren med å forstå hva figuren kommuniserer utover bare tall eller bilder. På denne måten gjør en godt utført tolkning og analyse dataene tilgjengelige og meningsfulle, noe som støtter bredere konklusjoner og forbedrer fortellingen.
Hovedfunn
Det neste viktige trinnet i beskrivelsen av en figur er å identifisere hovedfunnene. Dette innebærer å tydelig oppsummere hva figuren viser, for eksempel datapunkter, sammenhenger mellom variabler eller viktige resultater fra den visualiserte informasjonen. Dette trinnet er avgjørende for å sikre at leseren forstår hovedbudskapet i figuren og hvordan den henger sammen med det overordnede arbeidet eller studien. Uten en tydelig beskrivelse av de primære funnene kan publikum gå glipp av de viktigste aspektene ved dataene, noe som reduserer effekten av figuren.
For example, if the figure shows a comparison between two groups over time, the description should make it clear how these groups performed relative to each other and why this comparison matters. To learn more about how to enhance your findings with figures, check out the article “Enhance Findings With Figures” at: https://mindthegraph.com/blog/enhance-findings-with-figures/
Konsekvenser av figuren
Det er viktig å beskrive figurer på en effektiv måte for å formidle deres fulle betydning og øke forståelsen. Å diskutere betydningen av informasjonen innebærer å forklare hvordan dataene støtter eller utfordrer forskningsmålene, påvirker anvendelser i den virkelige verden og bidrar til dypere innsikt i emnet. Dette hjelper leserne med å forstå hvor viktig figuren er i en større sammenheng.
Forklar hvordan figuren bidrar til forståelse, blant annet ved å klargjøre komplekse konsepter, legge frem dokumentasjon og integrere figuren i den overordnede fortellingen om studien. Denne tilnærmingen sikrer at figuren styrker diskusjonen og gir en klar og meningsfull tolkning av dataene, noe som gjør den til et verdifullt verktøy for å fremme kunnskap og informere om beslutninger.
Endelig innsikt og betydning
Describing a figure effectively involves interpreting and analyzing the data it presents to transform it from a simple display into valuable insights. Key to this process is outlining the primary information, identifying patterns and trends, and highlighting significant points that reveal broader implications. This approach ensures that the figure’s core message is conveyed clearly and meaningfully, facilitating better understanding and decision-making.
Reiterating the figure’s importance within the context of the broader work, it serves as a crucial tool for elucidating complex concepts, supporting well-grounded conclusions, and enhancing the overall narrative. By integrating the figure’s insights into the broader discussion, it contributes significantly to advancing knowledge and enriching the understanding of the topic. Thus, a thorough description not only clarifies the figure’s role but also underscores its value in driving informed interpretations and decisions.
Stor gjennomslagskraft og større synlighet for arbeidet ditt
Mind the Graph offers a powerful platform designed to enhance the impact and visibility of scientific work. By providing intuitive tools for creating visually appealing and informative graphics, it enables scientists to present their research findings in a clear and engaging manner. The platform’s emphasis on high-impact visuals helps researchers effectively communicate complex data and concepts, thereby increasing the reach and influence of their work.Through its user-friendly interface and customizable templates, Mind the Graph facilitates the creation of figurer av profesjonell kvalitet og infografikk. Dette bidrar ikke bare til å gjøre forskningen mer tilgjengelig, men øker også sannsynligheten for siteringer og anerkjennelse i det vitenskapelige miljøet. Ved å forbedre presentasjonen av arbeidet sitt kan forskere tiltrekke seg større oppmerksomhet fra fagfeller, interessenter og offentligheten, noe som til syvende og sist fører til større synlighet og bredere gjennomslagskraft for forskningsbidragene deres.

Abonner på nyhetsbrevet vårt
Eksklusivt innhold av høy kvalitet om effektiv visuell
kommunikasjon innen vitenskap.

