2 minutos de lectura
08/19/2018
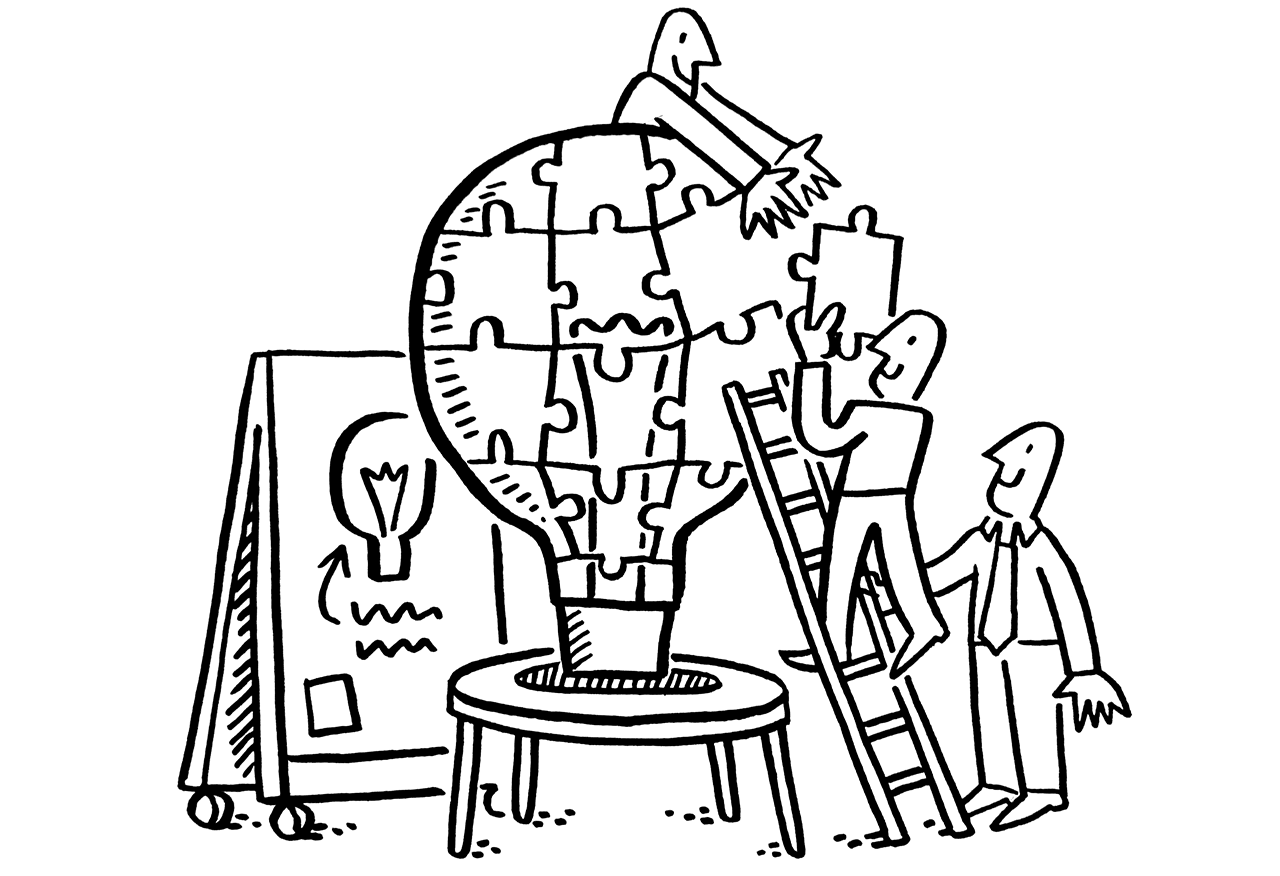
El blog científico Mind The Graph pretende ayudar a los científicos a aprender a comunicar la ciencia de forma sencilla.
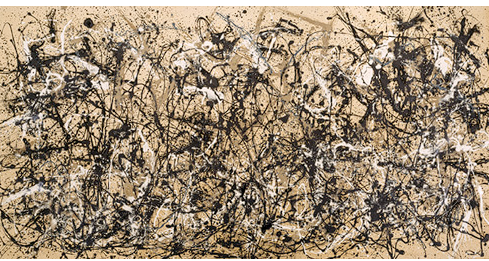
Cuando se trata de arte científico, la mayoría de nosotros piensa inmediatamente en ilustraciones súper realistas y complejas. Pero, ¿y si no tiene por qué ser así? Eso es lo que pensó Charley Harper. En una época en la que el arte científico consistía en ilustraciones que representaban fielmente los detalles más insignificantes del mundo real, Charley nos dio un nuevo [...]
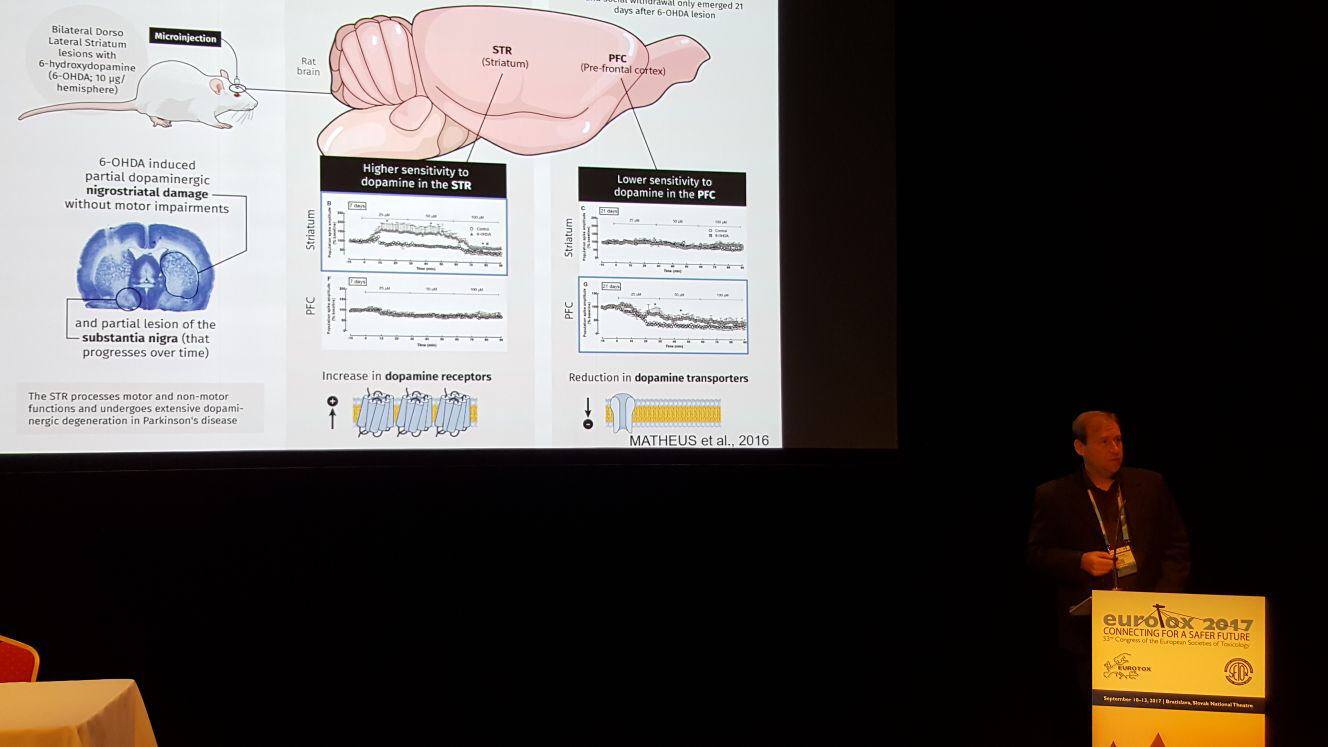
Post doctora en Ciencias Biológicas, Gabriela Trevisan está especializada en dolor y procesos inflamatorios. Su [...]
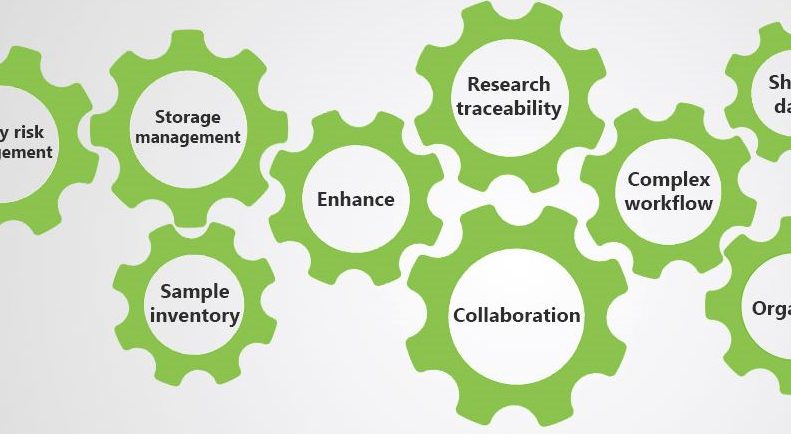
¿Y si te digo que hay una herramienta llamada LabCollector que puede hacer que tu [...]
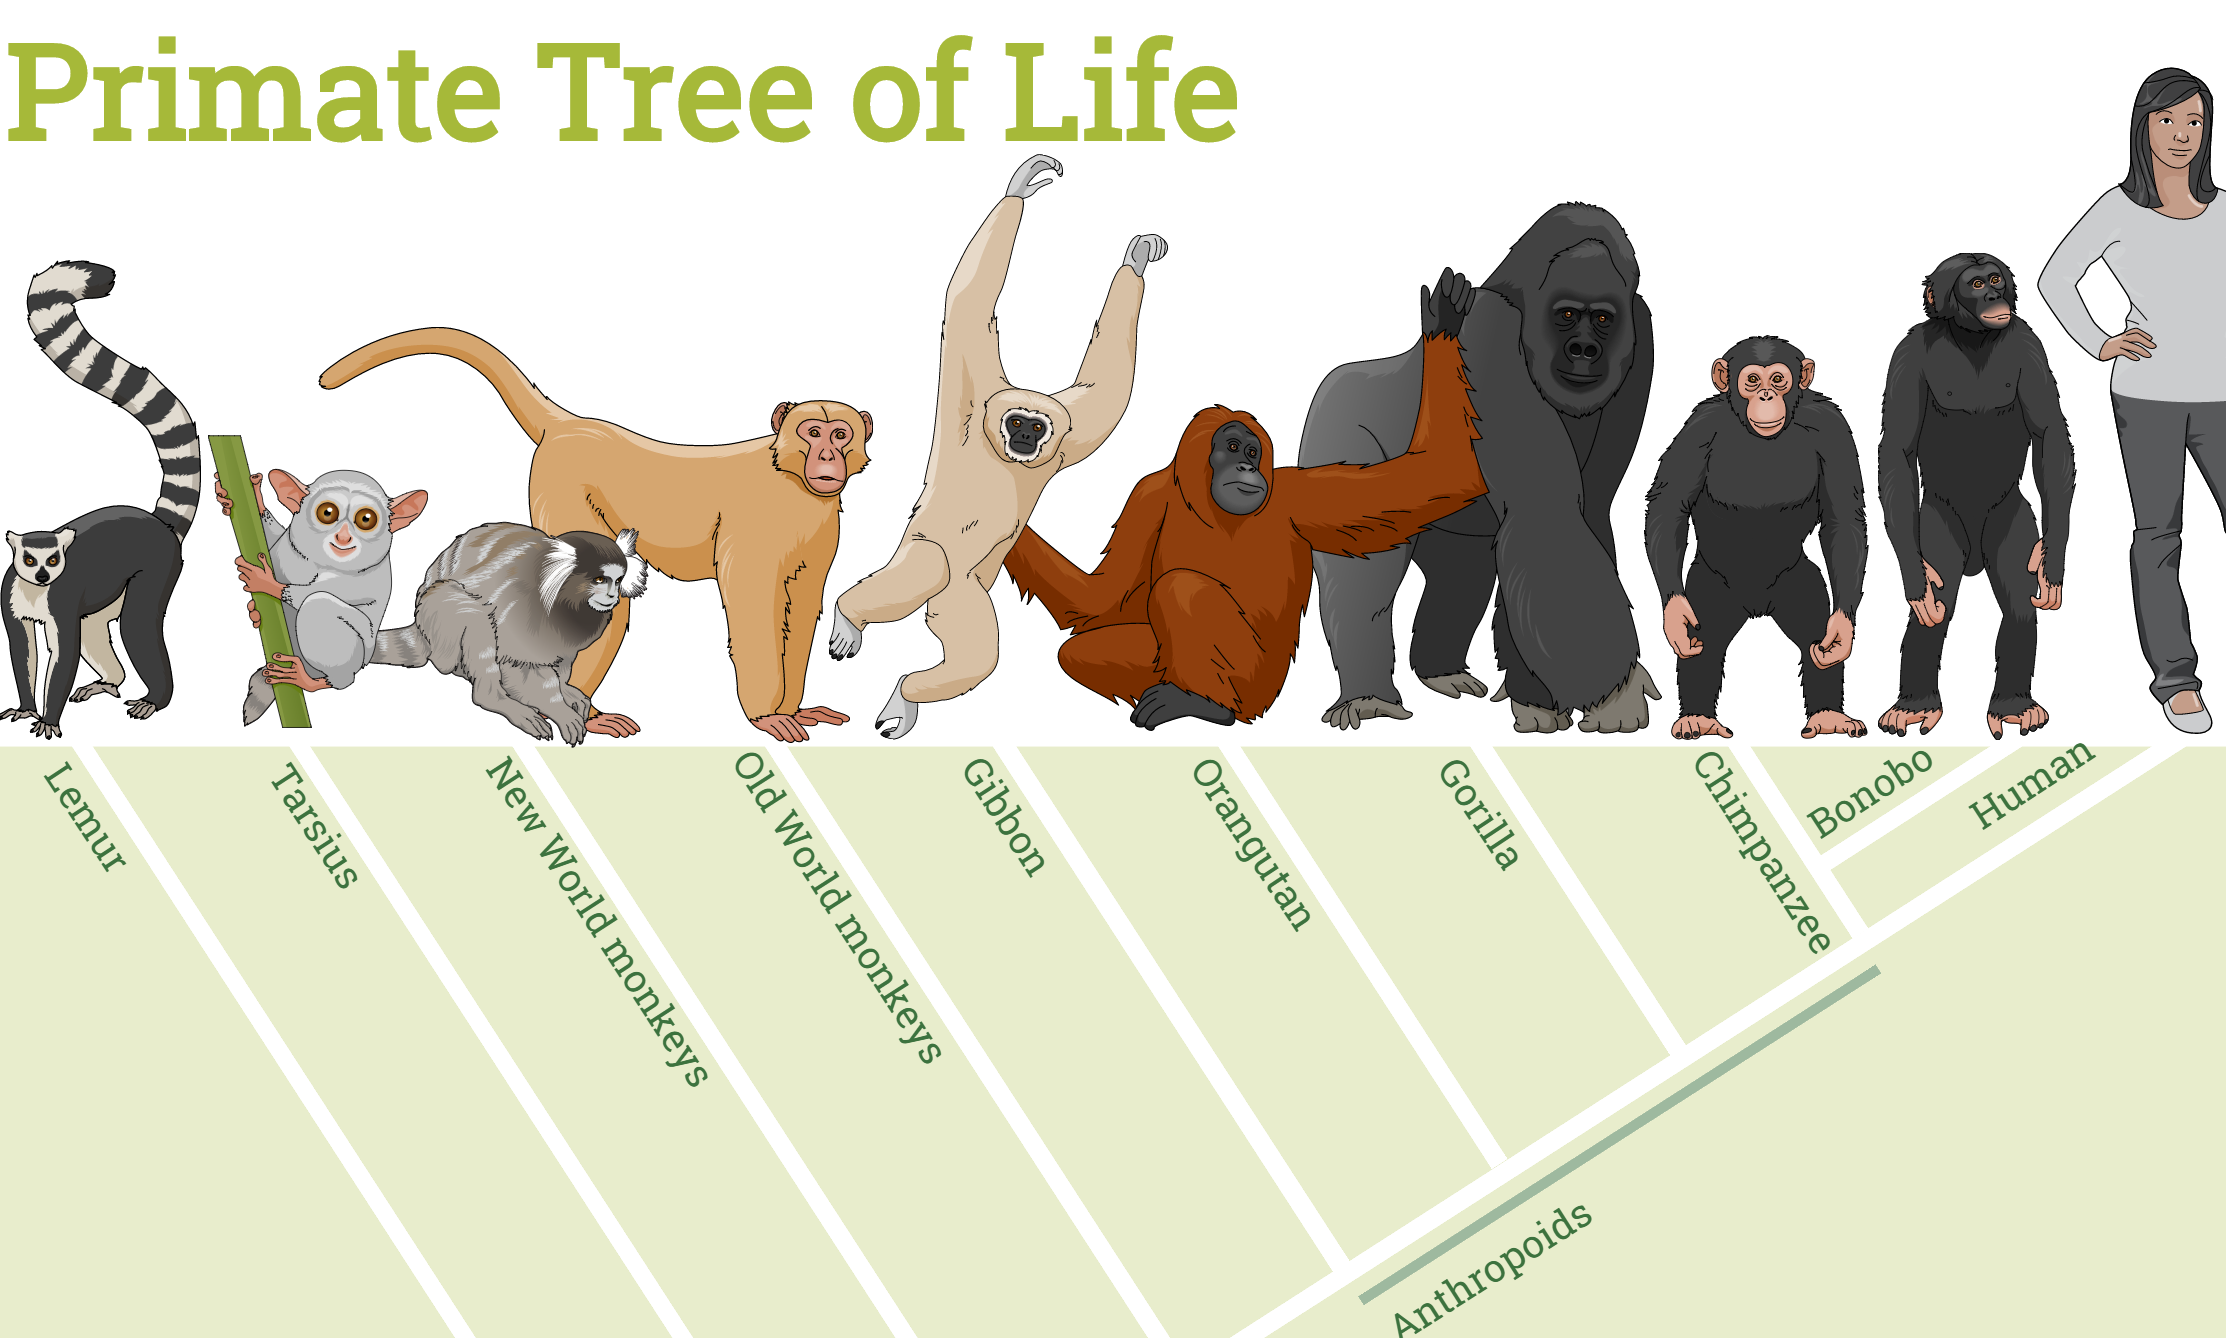
¿Necesita crear un árbol genealógico de primates? ¿O algo más relacionado con los primates? [...]
Trabajas durante años gastando dinero, presentando tus hallazgos en conferencias, enfrentándote a los retos diarios [...]
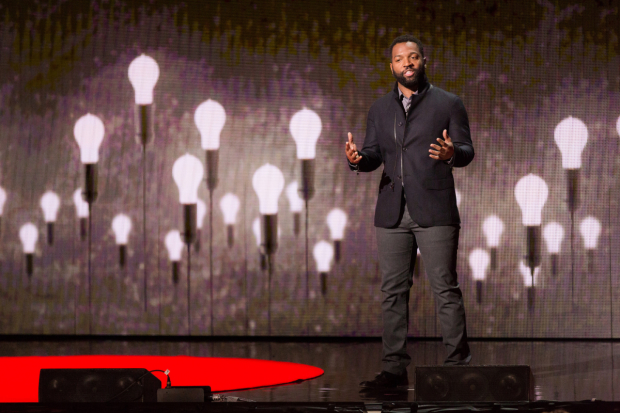
Todo el mundo conoce las charlas TED. Son informativas, innovadoras y están de moda. TED apareció por primera vez en 1984 [...]
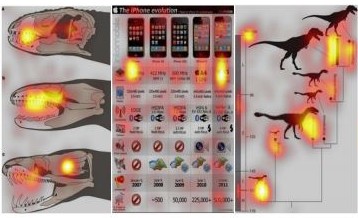
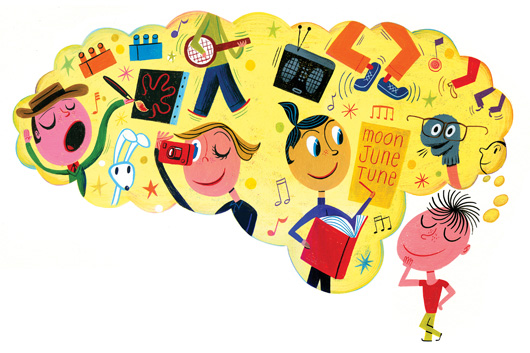
Una imagen vale más que mil palabras. Agradézcalo a su cognición visual. A menudo [...]
¿Se ha dado cuenta de lo que está ocurriendo en la comunicación científica? Cada día una ola de nuevos datos [...]
La vida laboral de un científico no es sólo "llevar una bata de laboratorio y hacer investigación". También tenemos [...]
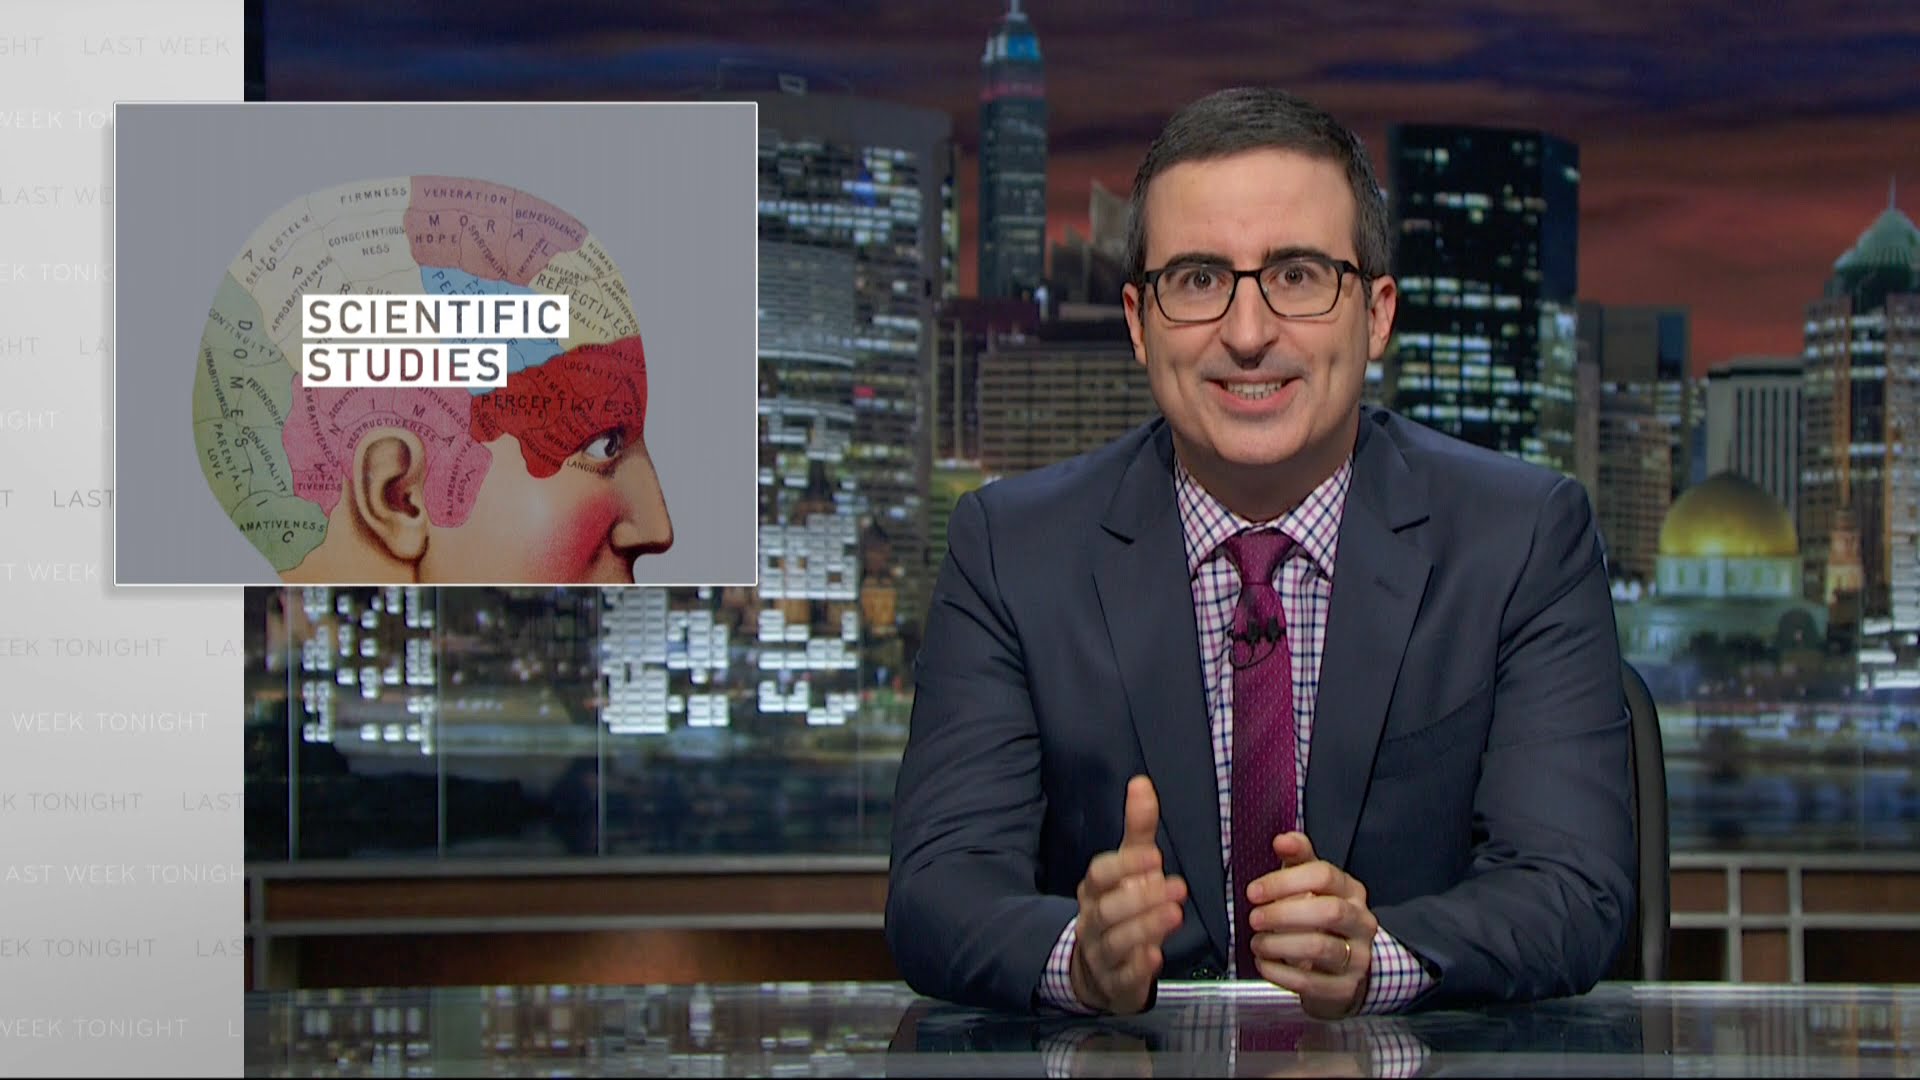
¿Con qué frecuencia se oye en las noticias que un nuevo hallazgo se basa en [...]
El mundo se mueve por estereotipos. Así, no es de extrañar que en la ciencia [...]
La humanidad lleva siglos haciendo descubrimientos. La rueda, los nuevos continentes, la penicilina y mucho más. [...]
¿Cuáles son las habilidades esenciales de un científico? Ser creativo, curioso y de mente abierta es una [...]