2 minutos de lectura
08/29/2018
El blog científico Mind The Graph pretende ayudar a los científicos a aprender a comunicar la ciencia de forma sencilla.
Publicar un artículo que nadie va a leer no es divertido. En cambio, es increíble descubrir que alguien en todo el mundo está leyendo y citando tu trabajo. Pero, ¿cómo saber qué ha pasado con tu investigación? ¿Cómo ser consciente del impacto que estás generando con tus publicaciones? [...]
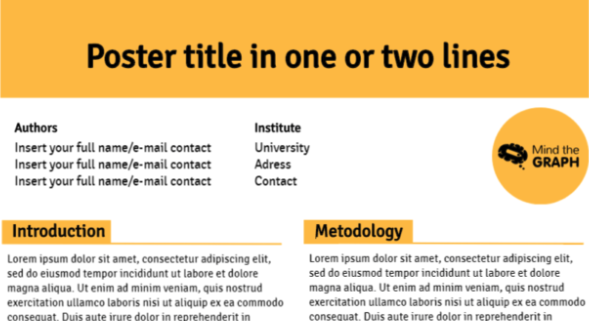
Presentar un póster científico es una forma habitual de comunicar una investigación científica. Es una [...]
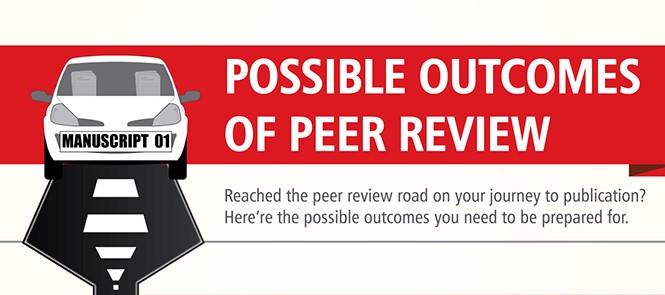
Una vez realizado todo el trabajo y revisado un par de cientos de veces, el tan esperado [...]
Si cree que publicar un artículo es la única forma de dar visibilidad a su [...]
Cuando el tema es la información, combinar cifras y textos no es ninguna tendencia. Llamarlo infografía [...]
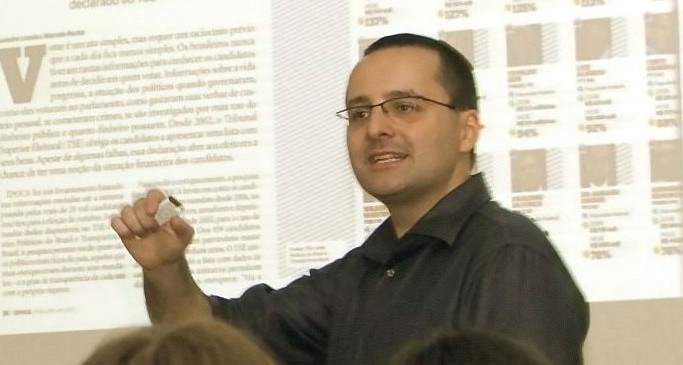
Referencia en la visualización de datos, Alberto Cairo es uno de los grandes nombres cuando el tema [...]
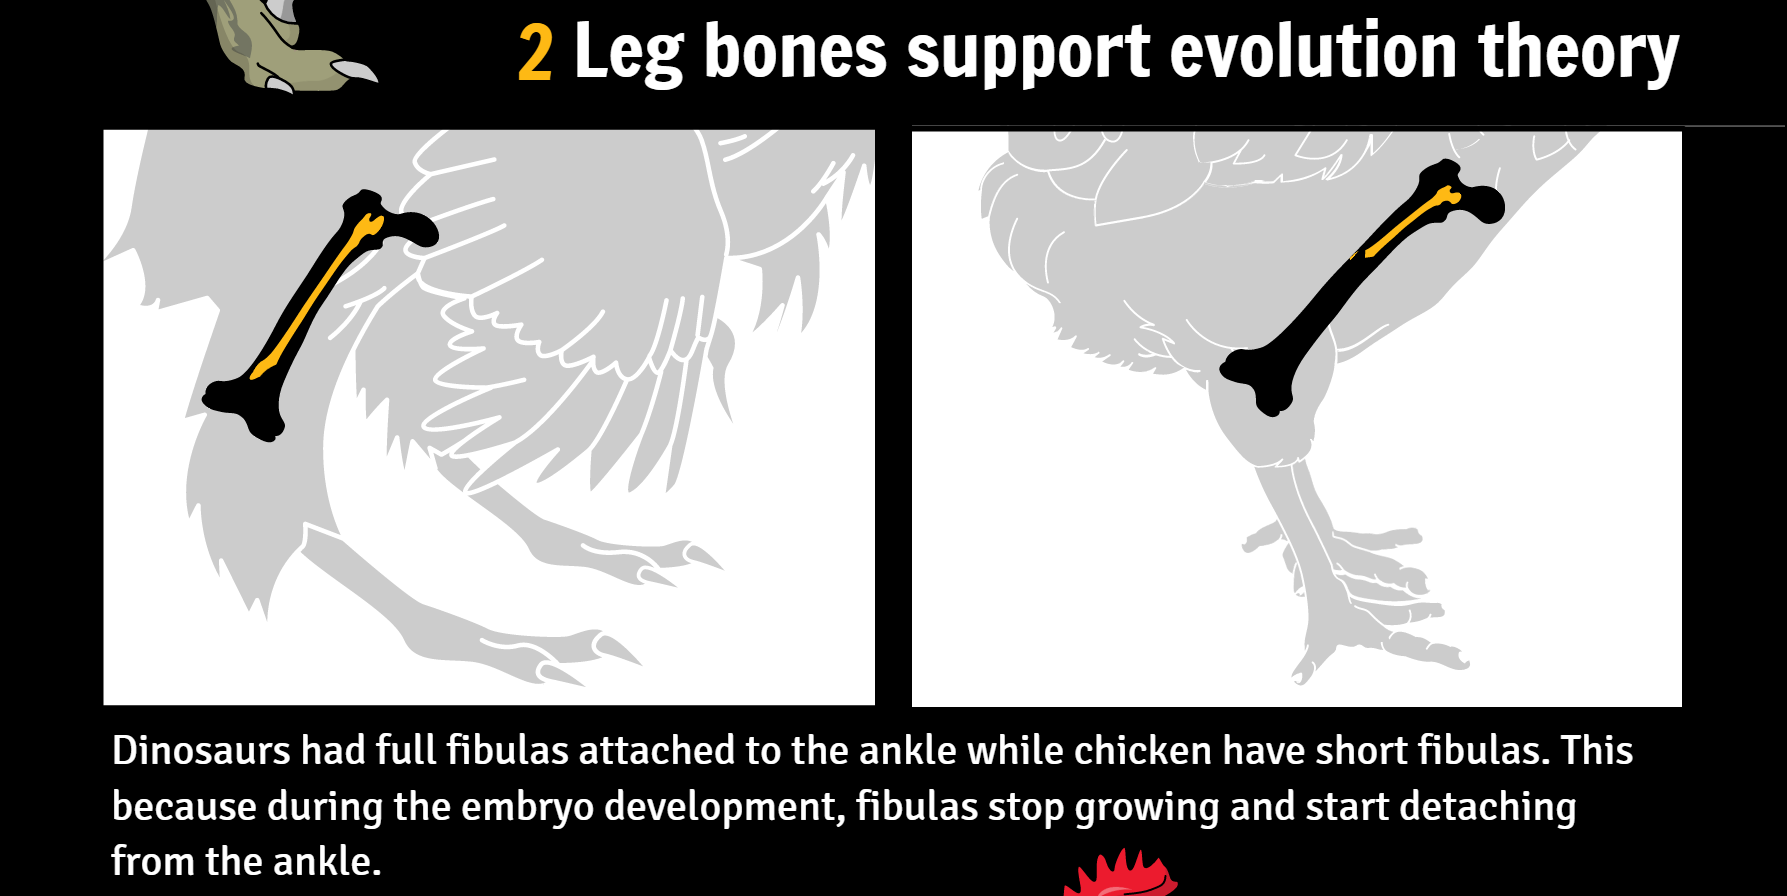
La semana pasada, Botelho et al. publicaron una nueva investigación sobre la manipulación de genes en pollos. Su [...]
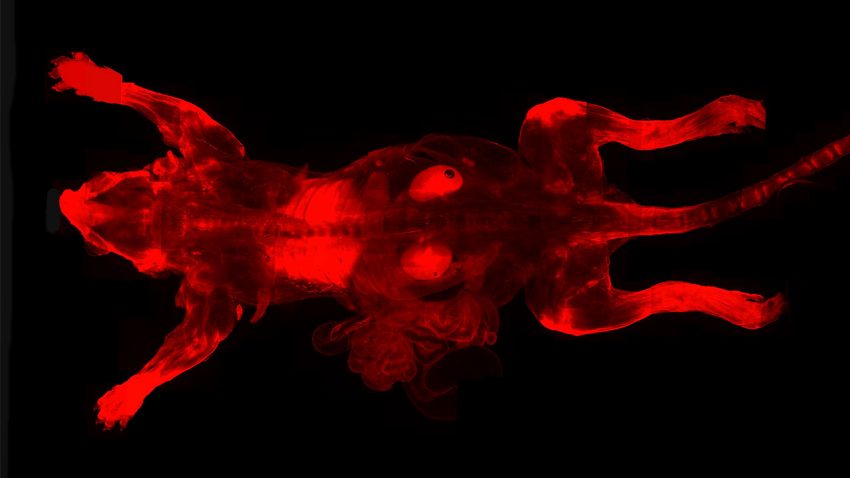
Las películas de ciencia ficción nos han dado esperanzas sobre el desarrollo de superpoderes como la invisibilidad, la superfuerza [...]
París, Francia y San Diego, CA (27 de octubre de 2016) - AgileBio, un proveedor global líder [...]
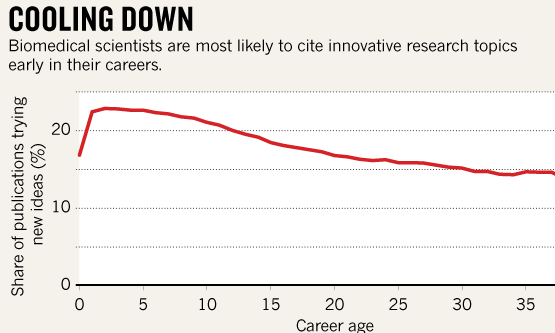
Isaac Newton Edad 45 años - Publicó los Philosophiae Naturalis Principia Mathematica (Principios matemáticos de [...]
Siempre es una celebración cuando vemos el increíble trabajo de nuestros usuarios. Ya escribí sobre [...]
Ser científico no es tarea fácil. La autonomía de tener tu propio trabajo viene [...]
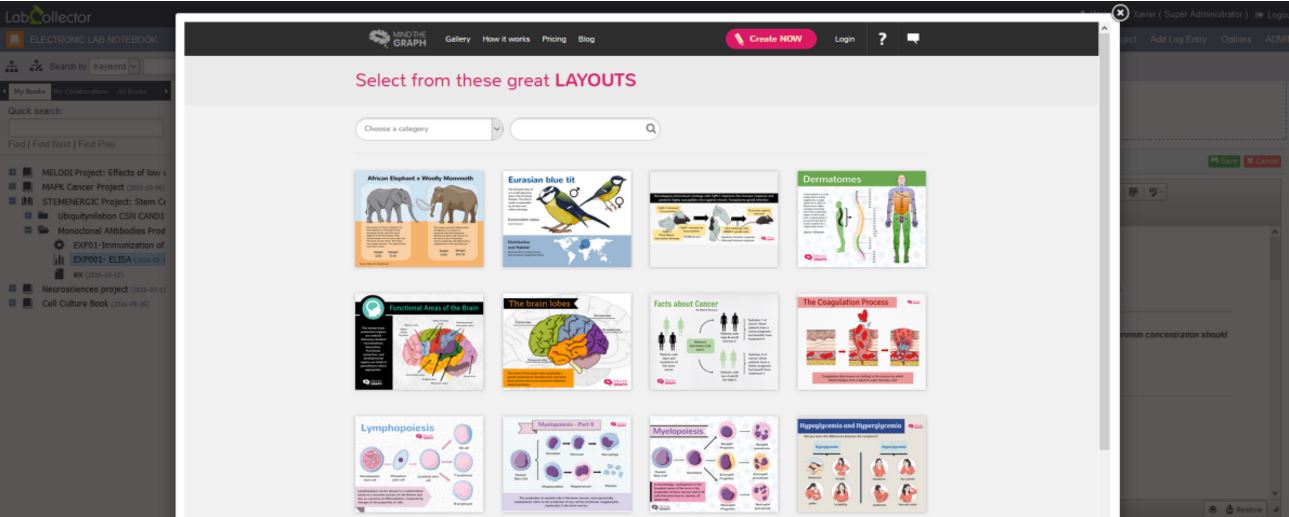
La primera impresión que tienen los usuarios de Mind the Graph una vez que entran en nuestra plataforma es: [...]