To communicate the importance of science in our society, we need first be able to communicate science in a better and easier way. Sometimes people struggle to understand science because it is hard to visualize. In Chemistry isn’t different. Molecules and chemical bonds aren’t easy to understand and visualize. So, you can use visual resources as scientific illustrations of a chemical structure to explain these topics.
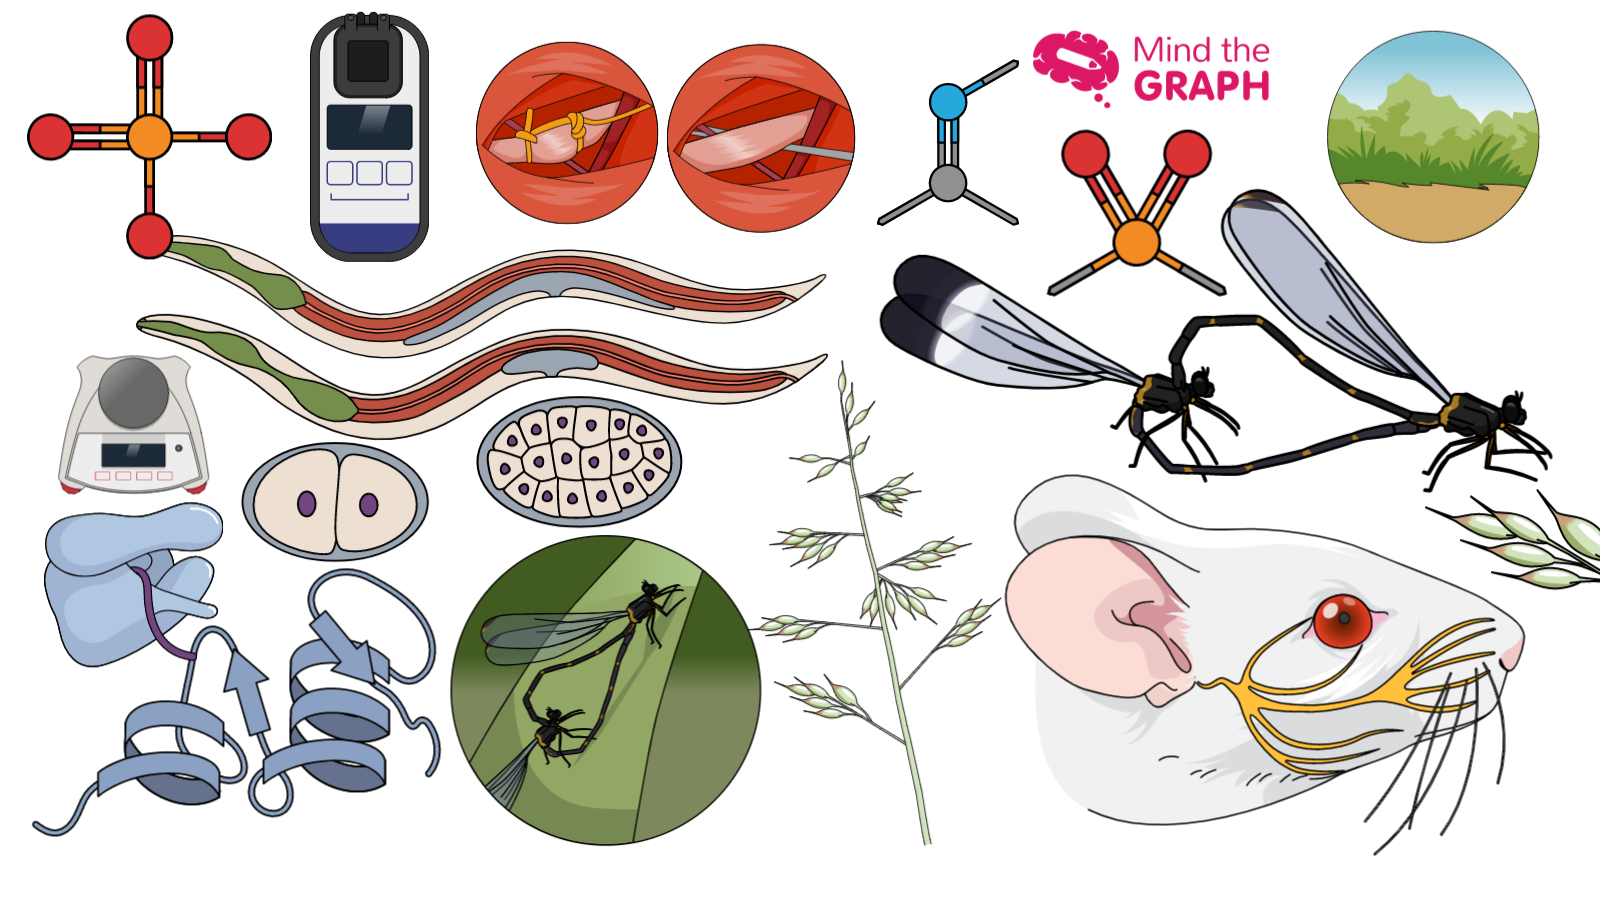
Scientific illustrations are a powerful tool to communicate better in science. Using illustrations you can create graphical abstracts, posters, presentations, book or magazines covers and anything you can imagine.
Using Mind the Graph illustrations to explain a chemical structure
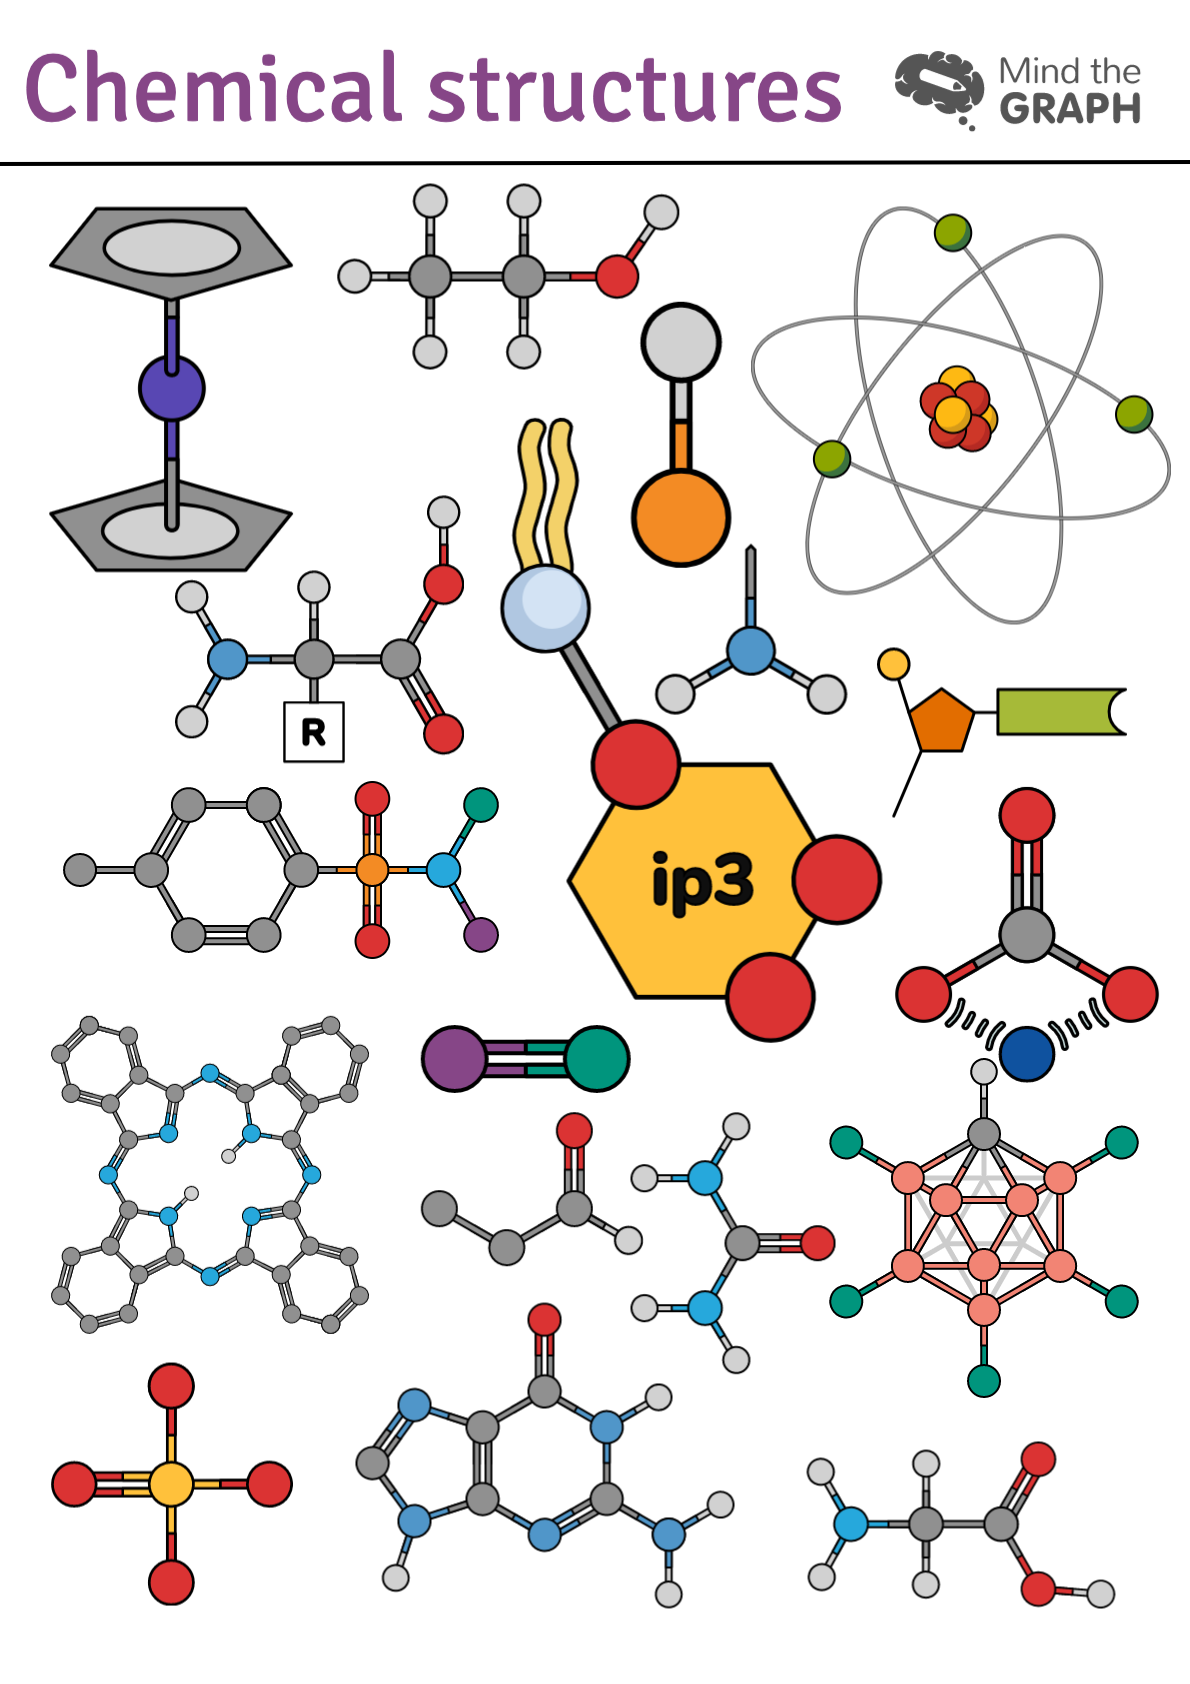
On Mind the Graph we have illustrations that show the chemical structure of molecules. Then, you can combine them to show bonds and interaction between molecules. Our illustrations have a pattern, so you can combine them in an attractive way. Also, each atom has a specific color, so the oxygen is always red, the nitrogen is blue, the calcium is green and so on.
We have over eight thousands of scientific illustrations and hundreds of them are of chemical structures. Take a look in some of them:
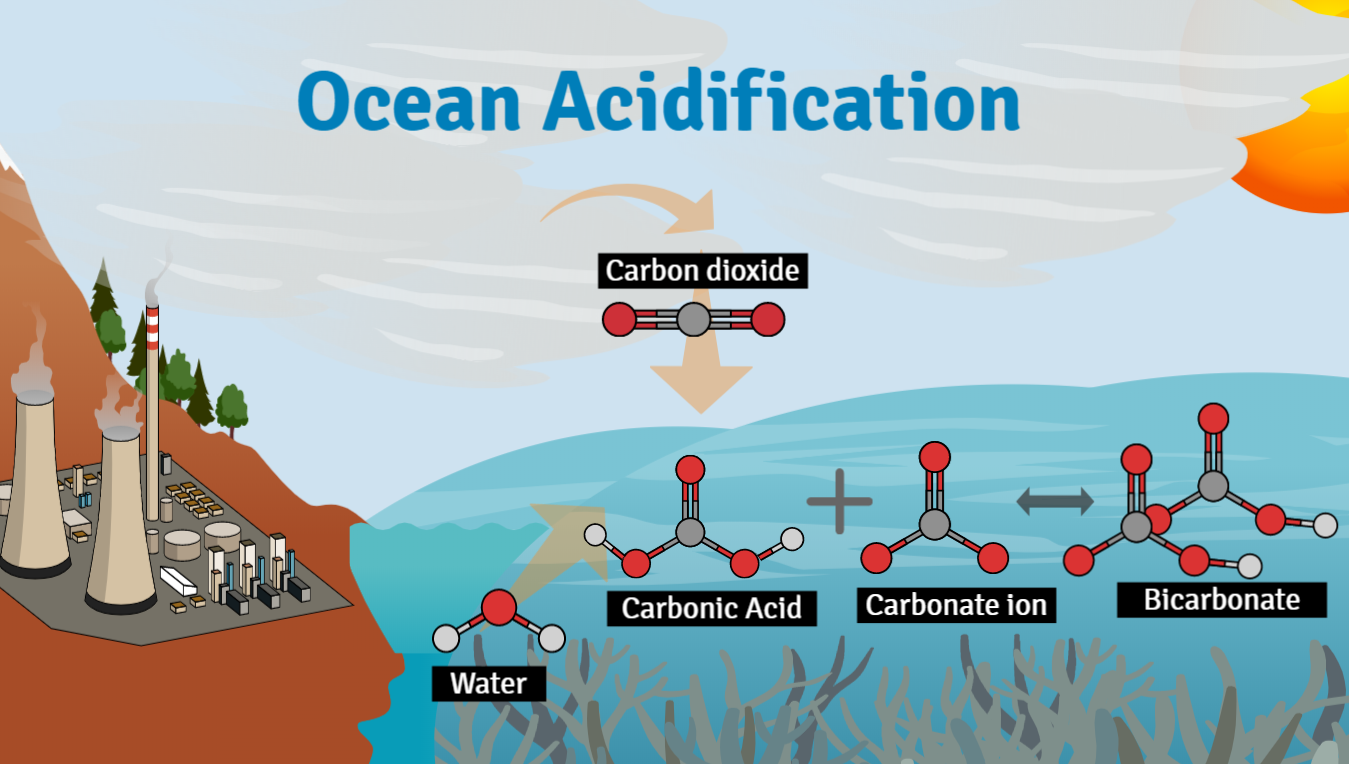
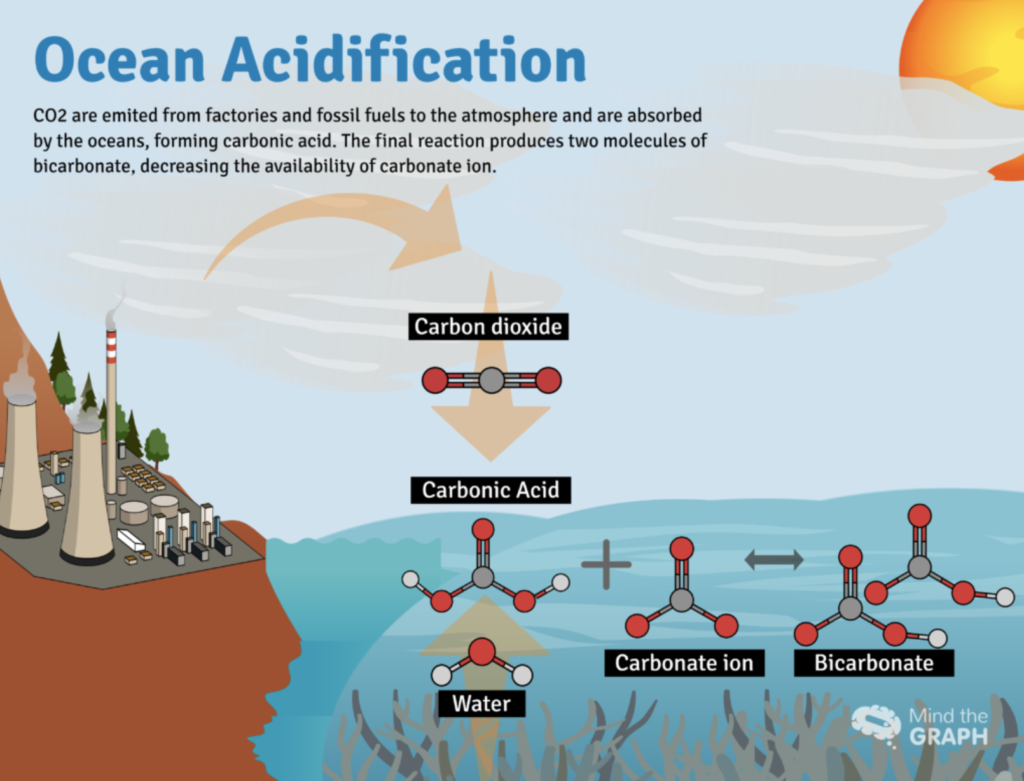
You can combine these illustrations with other ones to create your graphical abstract, take a look at this example of ocean acidification created at Mind the Graph:
If you want to use these illustrations or see the other ones, join us! You can start for free:

Subscribe to our newsletter
Exclusive high quality content about effective visual
communication in science.

