Mind the Graph Blog
  • Infographic maker
  • How it works
  • Tutorials
  • Portfolio
Mind the Graph Blog

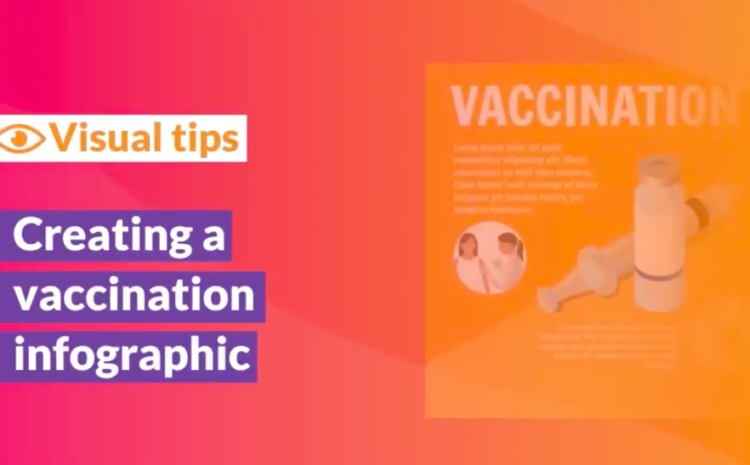
Tutorial video: creating a vaccination infographic template

Fabricio Pamplona Infographic, Tutorials April 15, 2020
Visual Tips - vaccination infographic
Tutorial on how to create an attractive vaccination infographic with scientific illustrations on Mind the Graph, the infographic maker for scientists and academics. We turn scientists into designers to boost their impact! If you liked the video, access Mind the Graph…Read more
wave

#22 Scientific illustrations of the week: Don’t miss it!

Fabiola Soares Portfolio July 26, 2019
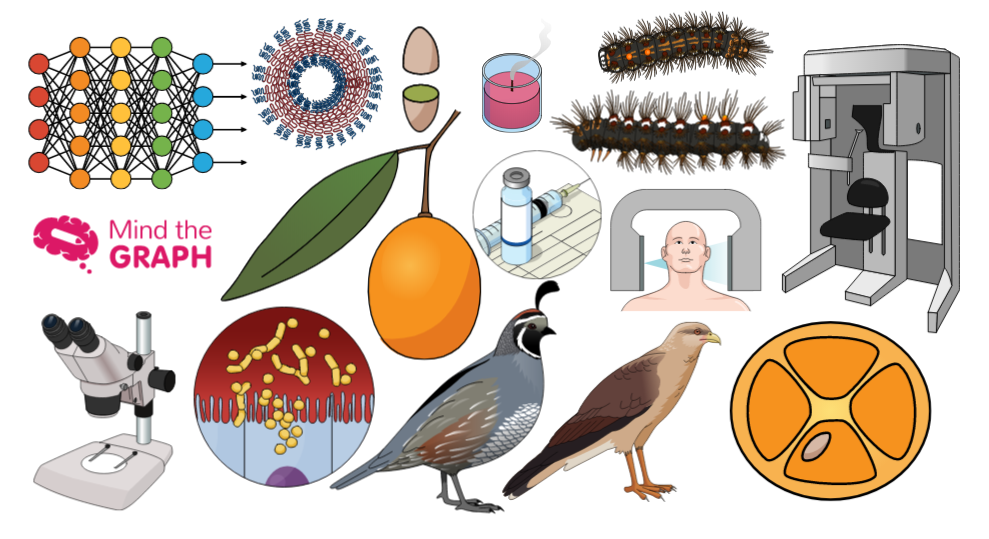
Friday is the day we show off our new scientific and medical illustrations. We already have over eight thousands illustrations in our library that are available to all mind the graph users (free users included). With these illustrations you can create graphical abstracts,…Read more
wave

An attractive science communication against fake news

Fabiola Soares Inspiration July 25, 2019
Science can change the world. This mean that we as scientists have an enormous power. But, how many people knows about our research? Also, how many people we are impacting with our data? If we want to improve our society…Read more
wave

Create beautiful scientific
infographics with no effort

We turn scientists into designers to boost your impact. Globally.

Try for free
TRUSTED BY
© 2019, Gutentim. All Rights Reserved