
It is essential to comprehend the significance of a sigmoid pattern or function, regardless of whether you build your own neural network or construct a model of yeast growth. Learning complex problems is explained by the sigmoid function and growth curves.
Dry mass is a more consistent indicator of growth when measuring growth. Our measurements of growth are typically based on how much we gain in height or weight since you cannot simply evaporate an organism.
As a result, sigmoid functions enable numerical parameter estimation because they are differentiable. Let’s take a look at what a sigmoid pattern or function is in this blog.
What is a sigmoid pattern?
It is important to note that many organisms undergo several distinctive phases of growth during their lifetime. A measurable size or weight variable over time can be used to quantify such patterns.
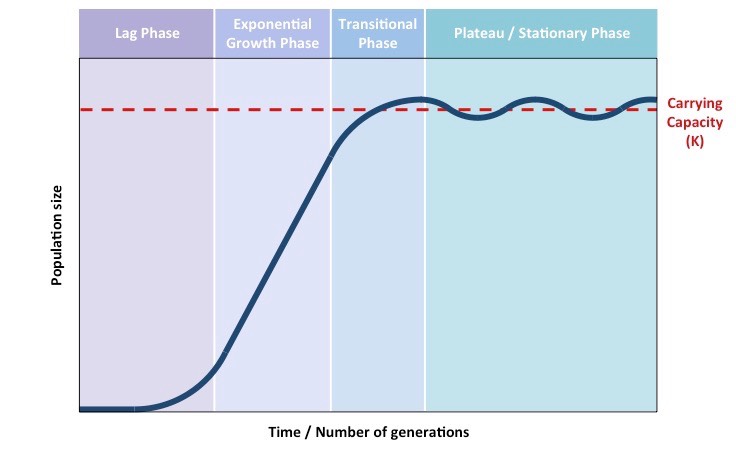
A sigmoid pattern is commonly observed in conditions that are generally consistent, and where a variable successively increases exponentially, then linearly, and at last asymptotically. An S-shaped curve, or sigmoid function, can be seen when plotted.
The normal distribution is included in sigmoid curves along with many other cumulative distribution functions. A neural network uses them as an activation function as well.
What is the significance of the sigmoid pattern?
Due to the monotonicity, continuity, and differentiation of the sigmoid function, along with its derivative, it is straightforward to formulate and update equations for learning different parameters.
A possible growth trajectory is represented by an s-curve when plotting the size of a population against time. To understand an organism’s life cycle, we need to consider this aspect.
Additionally, sigmoid functions can be employed in neural networks for modeling complex decision functions since non-linear functions result in non-linear limits.
A sigmoid pattern consists of three stages
There will be three primary phases to the curve, an accelerated stage/period, a transitional stage/period, and a plateau stage/period.
Exponential stage
In the early stages, population growth would be relatively slow (lag period) since few reproductive individuals would be broadly dispersed.
As natality surpasses mortality, population size is steadily growing. Energy is abundant, and climate resistance is minimal, which results in poor mortality rates.
Transitional Stage
Due to population growth, resources become scarcer, causing a struggle for survival. There is a slowdown in population growth as a result of decreasing natality rates and increasing death rates.
Plateau Stage
Eventually, the rising death rate will equal the production of new organisms, so population growth will plateau.
As a result of restricting forces, the population has outgrown the environment’s ability to cope with the increase. It is likely that the population size will not be steady at this point, but will fluctuate around the carrying capacity to maintain even numbers.
Exclusive scientific content, created by scientists
How is your paper coming along? Have you been searching for illustrations that correspond to your research? We’ve got your back with Mind the Graph.
From a library filled with thousands of illustrations, you can choose from a variety of categories. With our very own poster maker, you can get a fantastic poster in no time.
In addition, our experts can also customize illustrations according to your specifications.

Subscribe to our newsletter
Exclusive high quality content about effective visual
communication in science.