
Imagine you’re watching a magnificent sunrise unfurl. First, there’s a calm gradient across the horizon, then colors burst in rapid succession before finally settling into the bright light of day. This breathtaking transformation follows an alluring pattern—an ‘S’ shaped crescendo of change that both nature and businesses share. In the world of data analysis and project management, this visual unfolds as an “S curve function,” mapping growth that starts slowly, accelerates rapidly, and then plateaus elegantly. If you’ve ever been curious about how companies predict success or measure progress, stay tuned! We’re about to unravel the intriguing concept of the S curve function—a tool as fundamental as it is fascinating.
What is the S-curve function?
The S-curve function, also known as the sigmoid function, is like a story arc for data—a narrative graph where every statistic plays a character evolving over time. In other words, an S curve indicates the progress of a project over time. It depicts how values grow following a full sigmoid curve of shape—starting gradually, increasing sharply, and eventually leveling off to approach a climax without ever quite touching it. Often used to model the life cycle of products, growth patterns in populations or economies, and progression timelines in construction projects or technology development; it’s a universal language understood by analysts, economists, biologists, and engineers alike.
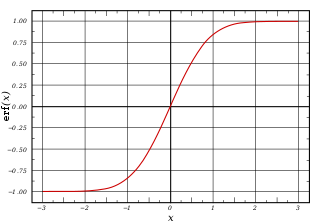
Sigmoid function example from Wikipedia.
This special curve embodies not just predictability but also embodies natural limits. Like a sapling stretching towards maturity, assumptions are made on bounded resources and space—reflecting real-world constraints within our ambitions and endeavors.
Let’s dive into its intricate layers! We’ll begin by exploring key characteristics that make up this compelling analytical protagonist. From there we will see where this function finds purpose—its roles, its equations—and learn how to interpret its nuances through practical examples from various industries. Ultimately revealing both its strengths as well as the challenges it faces today might hint at future enhancements for our brave little sigmoid hero—the elegant S curve function.
Key characteristics of the S-curve function
The essence of an s-curve function can be likened to a story with a beginning, middle, and end. When you delve into its traits, what stands out is how it elegantly models growth patterns – those that typically start slowly, accelerate, and then decelerate until reaching a plateau. Let’s explore these defining aspects of shaped curves in closer detail.
Initial Phase: Slow Growth
In its early stages, for example, the s-curve function represents a time of slow progress. Often obscured by limited visibility or adoption, this phase may seem inconsequential at first glance but lays the critical groundwork for future acceleration. It’s akin to planting seeds; there’s much occurring beneath the surface before we witness substantial growth.
Middle Phase: Rapid Increase
Following the crawl comes the sprint. The middle segment characteristic of an s curve is characterized by rapid expansion. In this dynamic period, adoption rates soar as more entities recognize and leverage the benefits on offer. Like wildfire catching amidst dry timber, growth surges forward with fervent momentum during this central phase.
- Widespread Acceptance: At this point, the concept or technology being tracked gains significant traction within its target market.
- Peak Performance: As we approach near-vertical ascent on our graph, performance metrics tend to hit their zenith.
Final Phase: Saturation and Plateau
Every surge must eventually find its limit. The final stage depicts a tapering off where new adopters dwindle and growth rates steady out to a plateau. It mirrors a saturation point – when the potential has been maximized given existing circumstances – indicating that either an innovation cycle must begin or alternative strategies should be deployed to revitalize growth.
- Deceleration: An inevitable softening in pace occurs as markets mature or resources become less readily available.
- Established Normalcy: A stabilization ensues which demonstrates that the s curve function’s journey finds its place in equilibrium – neither advancing nor receding substantially.
Understanding these key characteristics offers invaluable insight into numerous phenomena across various fields ranging from biology to economics and technology diffusion. By recognizing each phase for its unique attributes and implications, informed predictions and decisions can be made throughout an entity’s lifecycle.
Applications of the S-curve function
The S-curve function is a versatile tool that has found its place in various industries due to its distinctive shape and inherent predictability. It serves as a mathematical model for many growth processes that follow a slow start, rapid growth, and then a stabilization phase. Let’s delve into some of the practical applications where the S-curve function plays an indispensable role.

- Project Management: In project management, S-curves are utilized to track progress over time. By plotting work output or completion rates against time, analysts can assess whether projects are on track, ahead of schedule, or lagging. The initial flat part of the curve reflects the startup phase when progress is slow. As tasks commence at scale and efficiency increases, we see a steep upward trend—depicting heightened productivity followed by a plateau indicating approaching project maturity.
- Technology Adoption: Understanding how new technologies gain traction within markets is critical for businesses aiming to forecast trends and stay competitive. The S-curve models technology adoption rates with impressive accuracy; often beginning with innovators and early adopters before spreading to the broader public.
- Biological Growth: Another natural application of the S-curve lies in biology for modeling population growth within an ecosystem. Populations typically grow slowly when they’re first establishing themselves; accelerate as resources are plentiful; but eventually level off due to limitations such as space, food supply, or predation.
- Business Development: Whether it pertains to revenue growth or market penetration levels for new products, businesses frequently turn to sequential patterns predicted by s-curves functions—which encapsulate slow initial uptake followed by exponential growth until saturation is reached in the target market segment.
Moreover, these functions aren’t confined strictly to corporate contexts; they also emerge in areas like social science research exploring phenomena such as diffusion of innovations among cultural groups or linguistics where language usage might spread through populations in predictable waves captured elegantly by an S-curved lens.
By considering diverse scenarios from disease propagation models during public health crises—to sales forecasting arrays—the multifaceted usefulness of this mathematical construct cannot be overstated. Each case offers clear evidence: wherever there exists progression subject to constraints and capacity limits, you’ll likely find invaluable insights by applying an S-curve analysis framework.
Understanding the Mathematical Equation of the S-curve Function
When we delve into the mathematical foundations of the s-curve function, it all starts to demystify. Simply put, an s-curve is a type of mathematical model that depicts a quick uptick in growth, followed by a period of stability and eventual saturation – imagine it like a ‘stretched-out’ letter ‘S.’ This concept might seem impenetrable at first glance, but let’s break down its components to comprehend how it works.
Firstly, this function often takes root in logistic equations—foundational formulas behind many natural processes involving growth. The equation typically resembles something along these lines:
[ f(x) = \frac{L}{1 + e^{-k(x-x_0)}} ]
In this expression:
- ( L ) represents the maximum value of the function – essentially, it’s where the curve caps off or levels out.
- ( e ) is Euler’s number (approximately 2.71828), a constant that frequently appears in growth models and compound interest calculations.
- ( k ) is a positive number dictating the steepness of the curve. The larger ( k ) is, the steeper and more dramatic our ‘S’ will appear.
- ( x_0 ) denotes the midpoint; it’s literally at the core of our S-curve where growth shifts from accelerating to decelerating.
Now why are these elements important? They’re not just symbols on paper; each one has profound implications for accurately portraying real-world scenarios through an s-curve lens – whether forecasting population dynamics or predicting product adoption rates.
To grasp their essence further:
- The role of L: This chooses our boundary conditions. It sets up camp at either end of our graph, representing asymptotes—that means no matter how far along you go on your x-axis (be it time, effort, investment), you never quite touch L.
- Deciphering e and k: These constants tell us about timing and transitions. Combined with x, they determine when explosive growth happens and how abruptly we hit those high-gear moments before things level off.
Understanding these variables allows us insight into the control not just when things change but also how intensely those changes kick in—and most importantly, what limits exist on potential growth or spread within any given system encapsulated by an s-curve.
As complex as they may sound, knowing these parameters empowers us to spot patterns and predict outcomes in various phenomena characterized by initial acceleration followed by deceleration—a process typical in nature and industry alike. Equipped with such knowledge, stakeholders can discern stages in product lifecycles and growth processes or identify pivotal shifting points within market trends—all thanks to unpacking this pithy yet potent formula governing s-curves.
Parameters and Variables in the S-curve Function
To thoroughly grasp the s-curve function, it’s crucial to understand its parameters and variables. These components fine-tune the s-curve data and determine its shape and position on a graph. They play as vital elements that collectively describe the dynamics of growth or process being modeled.
Defining Key Parameters
The s-curve function typically includes several key parameters:
- Growth Rate (r): This reflects how quickly the underlying quantity is growing. Higher values indicate faster growth.
- Carrying Capacity (K): This parameter represents the maximum limit that the environment can sustain for a population or capacity constraint for a project.
- Inflection Point: The point on the curve where growth switches from accelerating to decelerating marks an essential phase in development.
Playing with Variables
In addition to these parameters, note that certain variables also affect the aspect of our s curve:
- Initial Value (a): It determines where along the y-axis our S-curve starts which could imply initial population size or initial investment among other interpretations.
- Time (t): As an independent variable, time is critical since it shapes how the curve progresses over a period.
Noticeably, tweaking any one of these could significantly shift or reshape your entire s-curve function. Conceptually akin to changing ingredients in a recipe, modifying parameters adjusts your outcome—one reason why understanding them is so pivotal.
Application-Specific Adjustments
Case-by-case basis adjustments reveal different industries’ unique challenges while using s curves:
- In biology, varying ‘r’ might reflect environmental changes affecting species growth.
- Meanwhile in business projects, altering ‘K’ would simulate adjusting market saturation levels.
Understanding which lever pulls to craft your desired trajectory forms part of strategic planning within a range of myriad sectors leveraging this versatile mathematical toolset.ToolStripButton
Case studies and examples of the S-curve function in different industries
The versatility of the S-curve function is evident across various sectors where it has been applied to model growth patterns, forecast demand, manage resources, and understand market dynamics. Let’s delve into some intriguing case studies that illustrate the widespread utility of this compelling analytical tool.
Technology Adoption Lifecycle
One of the most classic illustrations of the S-curve function can be seen in the technology adoption lifecycle. This model uses an S-curve to depict how new technologies are adopted over time within markets:
- Innovators spearhead by trying out novel tech.
- Early Adopters follow suit, drawn by curiosity and advantage-seeking.
- The Early Majority jumps on board as confidence in technology builds.
- The Late Majority arrives late but still ahead of laggards, usually due to external pressures or proven practicality.
- Finally, the Laggards, who traditionally resist change, gradually conform.
Each group represents a phase on the curve that correlates with population percentage and technology adoption levels—essentially epitomizing an S-curve’s ascent from early slow growth towards rapid acceleration before plateauing.
Pharmaceutical Industry Development
Pharmaceutical companies leverage the S-curve function during drug development and in their go-to-market strategies. The time it takes for a new medication to gain traction often follows an S-curvature from research & development (initial slow progress), clinical trial successes (acceleration), up until market saturation post-release (deceleration).
- Initial R&D struggles with trials reflect initial flatness.
- Accelerated adoption occurs after successful trials and FDA approval.
- Market saturation leads to a flattening at the top once most doctors have prescribed it, or a new competitor emerges.
This application method emphasizes not only business strategy but also helps public health officials estimate how quickly a new treatment might become broadly available to patients.
Renewable Energy Adoption
The renewable energy sector also displays classic characteristics consistent with an S-curve. As nations strive for sustainable energy solutions:
- Initial investments and technological breakthroughs advance slowly against traditional energy sources.
- Subsequently, policies, reduced costs, and increased efficiency ignite rapid growth—an upward swing in our S-curve scenario.
- Eventually, as renewables approach broad implementation and other innovative energies enter research pipelines, this expansion relaxes into a steadier state reflecting market equilibrium.
By analyzing these stages through an S-curve lens, policymakers can better predict investment cycles and necessary infrastructural changes for transitioning economically towards greener energy sources.
These examples underscore how potent the s curve function is when deciphering complex trajectories across diverse industries—be they isomorphic with technology diffusion or tracking pharmaceutical products’ lifecycles or charting renewable energy dispersal trends globally. It offers both strategic insights and nuanced foresight into resultant patterns unfolding over time—a rich source of actual data for planners seeking data-driven decision-making frameworks within their respective fields.
Advantages and Limitations of Using the S-Curve Function
Advancing through a deeper understanding, let’s break down the advantages and limitations that accompany the employment of just one such example of an s-curve function. This unique depiction not only enriches our knowledge but also serves as a practical tool in various applications.

The Upside: Harnessing the S-curve Function’s Potential
- Predictive Analysis: One significant advantage of using the s-curve function lies in its predictive prowess. By mapping out growth trends or adoption rates, businesses can forecast future developments with reasonable accuracy.
- Resource Allocation: It aids in discerning when to allocate resources more effectively during different phases of a project or product lifecycle—maximizing efficiency without squandering assets.
- Insight into Market Saturation: The s curve illuminates points where markets might reach saturation, allowing companies to strategize before diminishing returns set in.
Given these benefits, it becomes evident why so many have incorporated this analytical approach into their strategic toolkit. However, there’s another side to this functional narrative; certain limitations must be acknowledged.
Navigating the Challenges: The S-curve Function’s Shortcomings
The s-curve function, despite its strengths, is not without its caveats:
- Over-simplification Risk: At times, it may over-simplify complex systems by constraining them within its smooth-flowing structure. Richness and nuance could be lost if we rely too heavily on it for scenarios that actually exhibit unpredictable ebbs and flows.
- Hindsight Bias: There’s a tendency to fit data neatly onto an s curve post-event, cultivating a false sense of precision about how events unfolded versus unpredictable real-world dynamics.
- Predictive Limitations: Forecasts made with an s curve assume stability in conditions which can be misleading if disruptive elements alter prevailing trends or cycles dramatically.
Just like any model or function we use to navigate through intricate business landscapes or natural phenomena, the s curve has both its shining moments and areas where caution should be exercised. With that said, even with these limitations front of mind, the utility derived from this elegant mathematical concept cannot be underestimated—it remains a stalwart feature in the arsenal of anyone seeking to understand growth patterns within their domain critically.
In conclusion—acknowledging we create both lights and shadows—the journey forward will likely see us leveraging such tools while staying vigilant against their potential downsides. As we tread this path armed with awareness and insight drawn from functions like these, versatility remains key: being able to adapt strategies as new information surfaces always underpin success no matter what curves come your way.
Future developments and advancements in the study of the S-curve function
As we peer into the horizon of possibilities, the s-curve function—a mathematical model that eloquently describes growth patterns—continues to evolve. This elegant descriptor doesn’t just rest on its laurels; researchers and practitioners are fervently unpacking its potential, pushing boundaries ever further. Let’s delve into a few areas where future developments may unfold.
Integrating Artificial Intelligence and Machine Learning

The marriage of artificial intelligence (AI) with the classic s curve function presents a thrilling prospect. Imagine AI systems trained to analyze vast historical data in troves, recognizing hidden patterns of growth that might not be immediately apparent to human observers.
- Predictive Analytics: By blending machine learning algorithms with s-curve analysis, there’s tremendous potential to refine predictive models in sectors like finance, marketing, or supply chain management.
- Automated Adjustment: Advanced systems could continuously tweak parameters within s-curve models, allowing for real-time response to changing market dynamics or consumer behaviors.
This integration aims at elevating our understanding of growth dynamics beyond what was traditionally possible, turning it into an even more powerful analytical tool.
Cross-disciplinary Applications
Application and theory feed into each other continuously. The principles underlying the s-curve function could cross-pollinate with entirely different domains:
- Ecological Modelling: Biologists may apply refined versions of the s curve when attempting to project population changes due to environmental impacts.
- Sociology: Understanding societal trends can benefit immensely from enhanced s-curve models that incorporate complex variables influencing human behaviour over time.
The future lies in harnessing the elasticity of this concept across various sciences, leading to unexpected insights and solutions.
Enhanced Real-Time Data Utilization
An important advancement is occurring in how quickly and effectively real-time data input can be integrated into s curve modelling:
- Internet of Things (IoT): As our world becomes increasingly interconnected through IoT devices, there’s a surge in available data points. These can feed directly into dynamic s curve functions for much more timely analytics.
- High-Frequency Updating: Traditional uses often lead to static or infrequently updated curves. Yet imagine an adaptable function recalibrating itself periodically as new information streams in—it would revolutionize industries reliant on forecasting and trend analysis.
Such refinements would enable businesses and policymakers to react swiftly and decisively as situations unfold around them—turning reactive measures into proactive strategies.
Addressing Limitations Through Advances
Every innovation comes with constraints, which are often stepping stones for further progress:
- Experts recognize limitations inherent in current representations of the s curve function—chiefly its assumption of ‘smooth’ progression without factoring in abrupt shifts.
- Developing advanced modeling techniques can help accommodate irregularities such as sudden market changes or disruptive technologies presenting non-linear growth behaviors contrary to traditional projections.
Researchers aim at crafting extensions or alternatives that can envelop these complexities better than today’s models while still preserving their interpretative clarity.
In essence, expect the science behind the s-curve function not merely to grow but also mature—as any living subject does under careful nurture. Its trajectory suggests exciting times ahead for those keen on deciphering such growth and dynamics across myriad dimensions—from startup ventures blossoming overnight to global economies advancing steadily forward—and everything between these spectrums. It stands firm; poised assertively at the juncture between established wisdom and cutting-edge discovery—ready surely for tomorrow’s unknowns it will illuminate magnificently yet again!
Create your S curve function diagram with Mind the Graph
Mind the Graph stands out as the premier tool for crafting S-curve function diagrams with unparalleled precision and user-friendly features. Its intuitive interface seamlessly guides users through the process of creating visually stunning S-curves, ensuring that even those with minimal graphic design expertise can effortlessly produce professional-quality diagrams.
Whether you are a seasoned professional or a novice in data visualization, Mind the Graph is the go-to tool for effortlessly bringing S-curve function diagrams to life, making it an indispensable asset for researchers, analysts, and anyone seeking to communicate their data with clarity and impact. Sign up for free and start creating now!


Subscribe to our newsletter
Exclusive high quality content about effective visual
communication in science.