
The results section of a research article is a component that plays an important role in conveying the findings and outcomes of a study. It is like the backbone of scientific communication, providing a comprehensive account of the data collected, analyzed, and interpreted during the research process. The importance of the results section cannot be overstated, as it allows researchers to present their discoveries, draw meaningful conclusions, and contribute to the existing body of knowledge in their respective fields. Through clear and concise presentation of data, effective data interpretation, and logical organization, the results section enables researchers to communicate their findings with precision, transparency, and credibility. In this article, we will explain the significance of the results section, exploring its role in showcasing research outcomes, facilitating scientific discourse, and advancing the scientific understanding of various phenomena.
Introductory Context
The introductory context restates the research problem and provides a brief overview of the research design, methodology, and objectives. It establishes the relevance and significance of the presented findings by connecting them to the initial research problem. By including this context, readers can understand the purpose and significance of the results and have a framework for interpreting the data. It acts as a guidepost, orienting readers and facilitating their comprehension of the findings within the broader context of the study. It is also a reminder and refresher for readers, helping them understand the relevance and significance of the presented findings.
Previous Findings
Previous findings refer to the relevant research or studies that have been conducted before and are directly related to the research problem being investigated. This part briefly summarizes the key findings of previous studies that have influenced the current research. It provides a foundation for understanding the current study’s contribution to the existing knowledge in the field and highlights any gaps or areas of controversy that the current research aims to address.
Logical Sequence
Logical sequence is where the organization and presentation of the results coherently and logically are done. It ensures that the results are presented in a logical order that follows the research objectives and methodology. It may group similar findings, organize them chronologically, or present them based on specific research questions or hypotheses. A logical sequence allows readers to follow the flow of information easily and understand the connections between different findings.
Target Journal
The target journal is the journal to which researchers intend to submit their work. Researchers may discuss the relevance of their findings to the journal’s subject area and highlight the potential impact of publishing in that specific journal. By mentioning the target journal, researchers demonstrate their awareness of the scholarly landscape and their aspirations to contribute to the scientific discourse within their field. This section provides valuable context for readers, indicating the researchers’ strategic decision-making and showcasing their intention to reach a specific audience with their work.
Related article: Title Page in Research Paper: Importance, Guidelines & Examples
Statistical Analysis
Statistical analysis is the method used to analyze and interpret the data collected in the study. It explains the specific statistical tests or techniques employed to analyze the data. It describes the rationale behind the choice of statistical analysis and provides details on the parameters and assumptions considered. The results of the statistical analysis should be presented clearly and concisely, including relevant statistics, p-values, confidence intervals, and degrees of freedom.
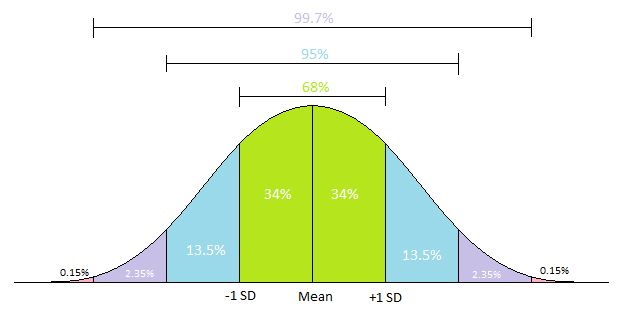
Standard Deviations
Standard deviations represent a measure of the dispersion or variability of the data points around the mean. It presents the standard deviations of the variables analyzed in the study. It provides information about the spread of the data and helps to assess the consistency or variability of the results. Standard deviations can be reported for individual variables or as a summary measure across different groups or conditions. They are often presented alongside means or as error bars in graphs or tables to provide a comprehensive understanding of the data distribution.
Correlation Between Motivation And Results
The correlation between motivation and results is the relationship or association between these two variables. This shows whether there is a statistical correlation between the level of motivation (independent variable) and the obtained results (dependent variable) in the study. The strength and direction of the correlation are assessed using the correlation coefficient and the results should include the correlation coefficient value and its statistical significance, indicating whether the correlation is positive, negative, or negligible.
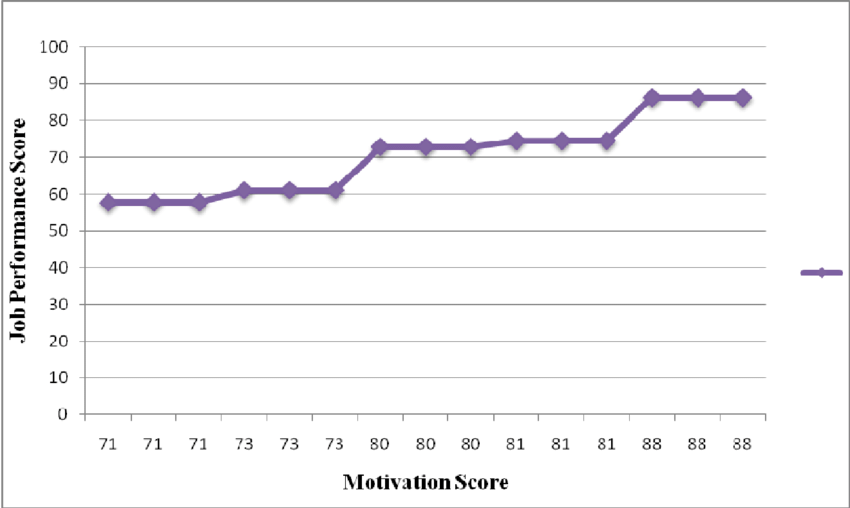
This graph shows the linear result of the relationship between job performance and motivation.
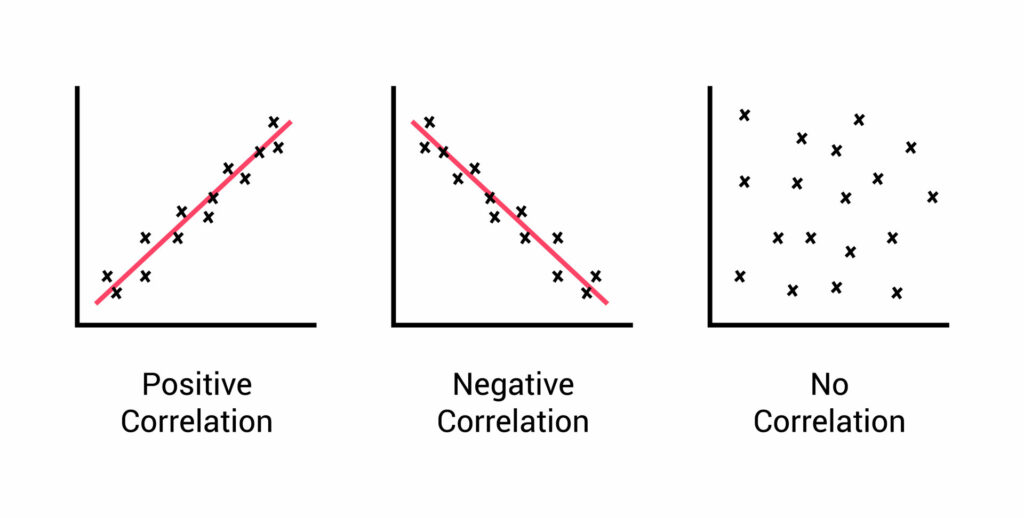
Strong Correlation And No Correlation
A strong correlation refers to a significant and robust relationship between two or more variables. It means that as one variable changes, there is a consistent and noticeable change in the other variable. The correlation coefficient, which ranges from -1 to +1, quantifies the strength and direction of the relationship. A correlation coefficient close to +1 indicates a strong positive correlation, meaning that as one variable increases, the other variable also tends to increase. Conversely, a correlation coefficient close to -1 indicates a strong negative correlation, implying that as one variable increases, the other variable tends to decrease.
On the other hand, a no correlation, or an unusual correlation, refers to unexpected or surprising associations between variables that deviate from what is typically observed or hypothesized. It implies that the relationship between the variables is not in line with common expectations or existing theories. Unusual correlations can be intriguing and may require further investigation to understand the underlying reasons for such unexpected patterns.
Also read: From Data to Discovery: The Findings Section of a Research Paper
Visual Elements
Visual elements indicate the graphs, charts, tables, or images used to present the data and findings visually. It emphasizes the importance of including well-designed and informative visual elements to enhance the understanding of the results. It discusses the types of visual representations appropriate for the data, such as bar graphs, line graphs, scatter plots, or heatmaps, and highlights their benefits in conveying complex information. The visual elements should be carefully labeled, properly scaled, and clearly presented to ensure accurate interpretation by readers.
Related article: The Ultimate Figure And Table Legend Guide
Choosing Elements
Choosing elements for the results section in research articles requires careful consideration. Visual elements should be relevant to the research objectives, clear, and representative of the data. They should provide a comprehensive overview of the results and use appropriate visualizations. Ethical considerations should be followed, and consistency in style and formatting should be maintained. Supplementary figures can be used when necessary, and cross-referencing and integration with the text should be implemented.
Figure Legend
A figure legend is a concise description or explanation of the content presented in a figure. It highlights the significance of providing clear and informative figure legends to accompany each visual element. The figure legend should succinctly describe the key features or variables represented in the figure and provide any necessary explanations or definitions. It helps readers understand the data and context of the figure without needing to refer back to the main text. The figure legend should be located directly below the figure and written in a concise yet informative manner.
Discussion Sections
The discussion section is a component that follows the presentation of the results. This provides an opportunity to interpret and analyze the findings in the broader context of the research question or hypothesis. It allows researchers to discuss the implications of the results, compare them with previous studies, and offer explanations or theories for the observed outcomes. The discussion section also provides a platform to address any limitations or potential sources of bias in the study and suggest avenues for future research. It should be structured logically and present a coherent narrative that connects the results with the research objectives.
Key Findings And Implications For Future Research
The key findings and implications for future research articles summarize the significant outcomes of the study and their implications for advancing the field. It highlights the main findings that align with the research objectives, discusses their importance about existing knowledge or theories, and suggests directions for future research to expand upon the current findings and deepen the understanding of the topic. This serves as a roadmap for future studies, guiding researchers to build upon the findings, address gaps, and contribute to the ongoing development of the research area.
Secondary Findings And Unanticipated Conclusions
Secondary findings and unanticipated conclusions are the additional findings or unexpected outcomes that were not the primary focus of the study but emerged during the research process. This section acknowledges and discusses these secondary findings, highlighting their relevance and potential implications. It explores their connections to the primary findings and their contribution to the overall understanding of the research topic. It also addresses any limitations or uncertainties associated with these secondary findings and offers insights into how they could be further explored or incorporated into future research endeavors.
Online Infographic Maker For Science
Mind the Graph is an online infographic maker designed specifically for scientists, offering a range of powerful tools to create visually stunning and scientifically accurate infographics. With its user-friendly interface and extensive library of pre-made templates, scientists can effortlessly communicate their research findings, data, and concepts in a visually appealing and engaging manner. From illustrating complex scientific processes to presenting data clearly and concisely, Mind the Graph empowers scientists to effectively convey their scientific ideas, making complex information accessible and captivating to a wide audience. Sign up for free.


Subscribe to our newsletter
Exclusive high quality content about effective visual
communication in science.