4 minutos de leitura
07/30/2019
Mind The Graph Scientific Blog foi criado para ajudar os cientistas a aprender a comunicar a ciência de uma forma descomplicada.
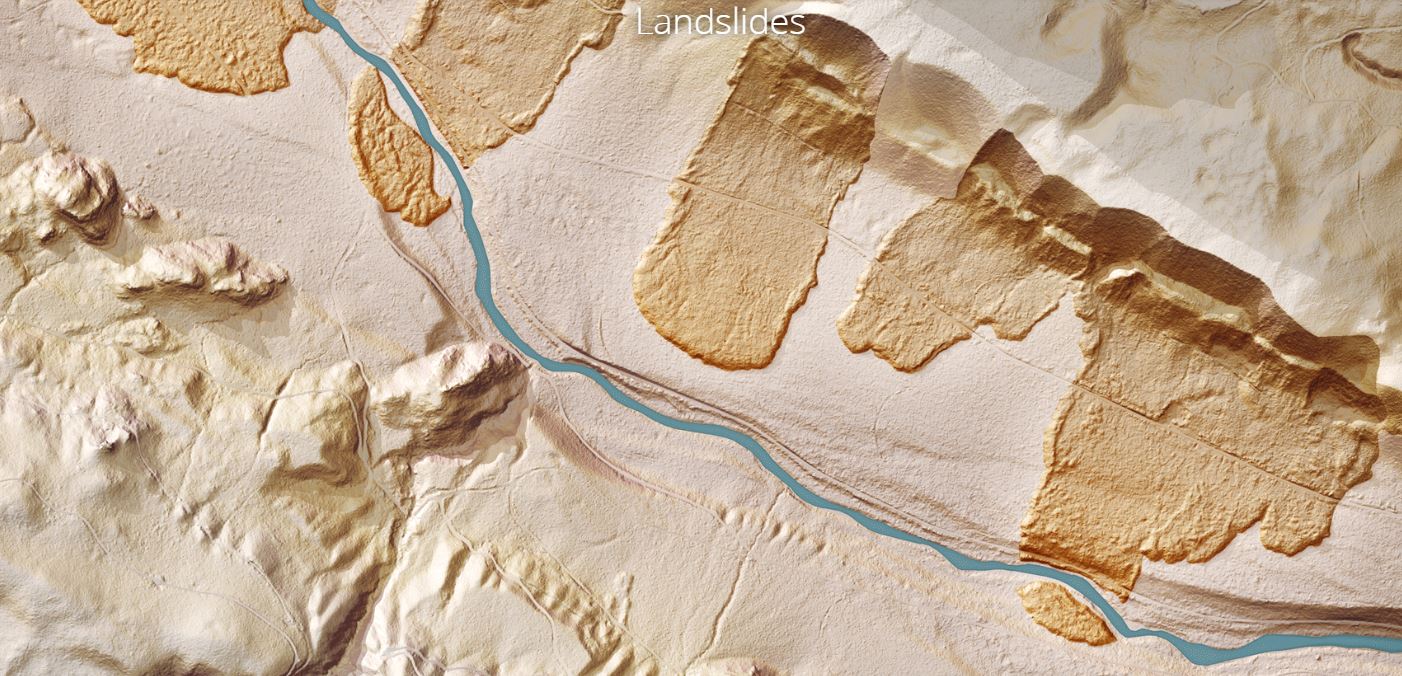
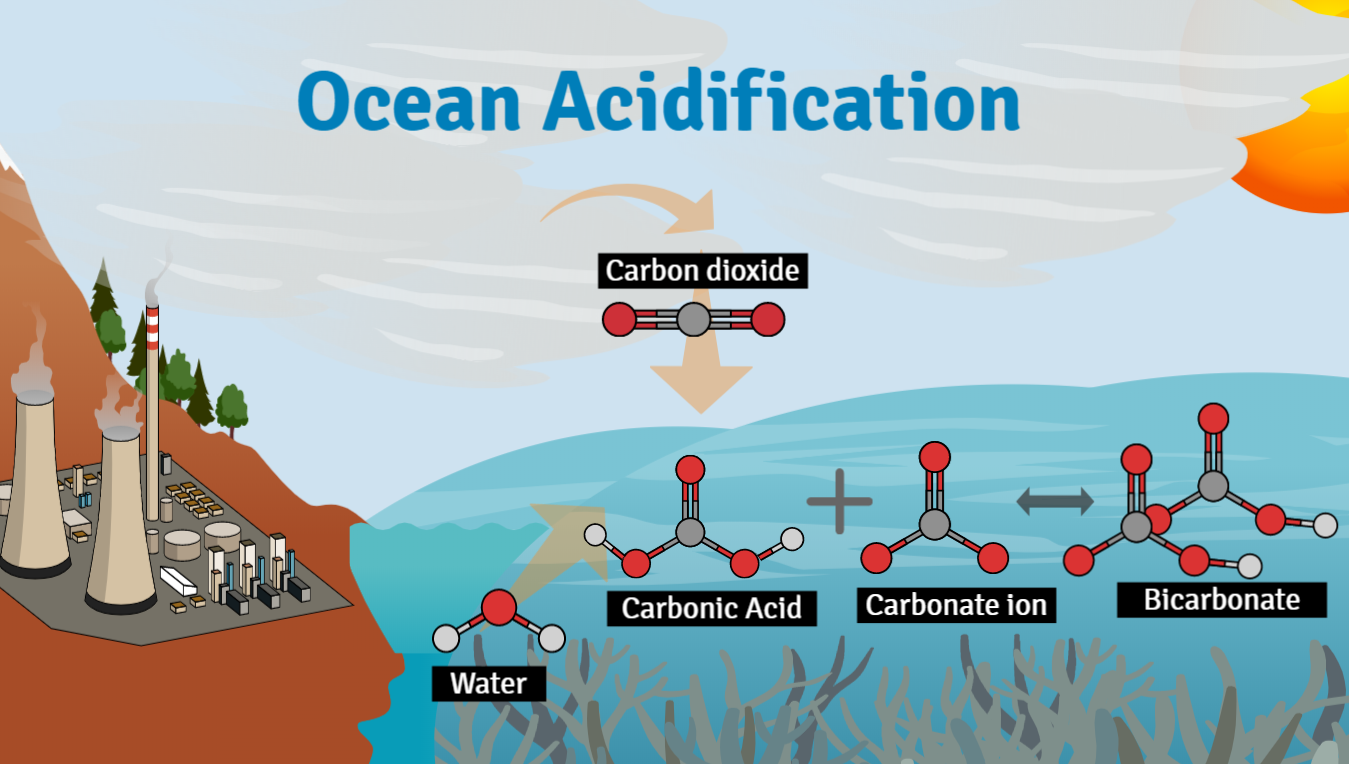
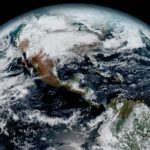
A mudança climática está sendo um assunto controverso nos dias de hoje. Podemos ver em todas as mídias sociais negação e pessoas céticas. No entanto, todos os dias, os cientistas chegam a novos dados, conscientizando sobre as conseqüências de nossos hábitos. Mas, os seres humanos estão realmente causando o aquecimento global? De acordo com a ciência, sim. Agora, três estudos publicados sobre a Natureza este [...]
Olá! Ser um cientista significa estar atualizado em tudo sobre ciência. Ainda mais, [...]
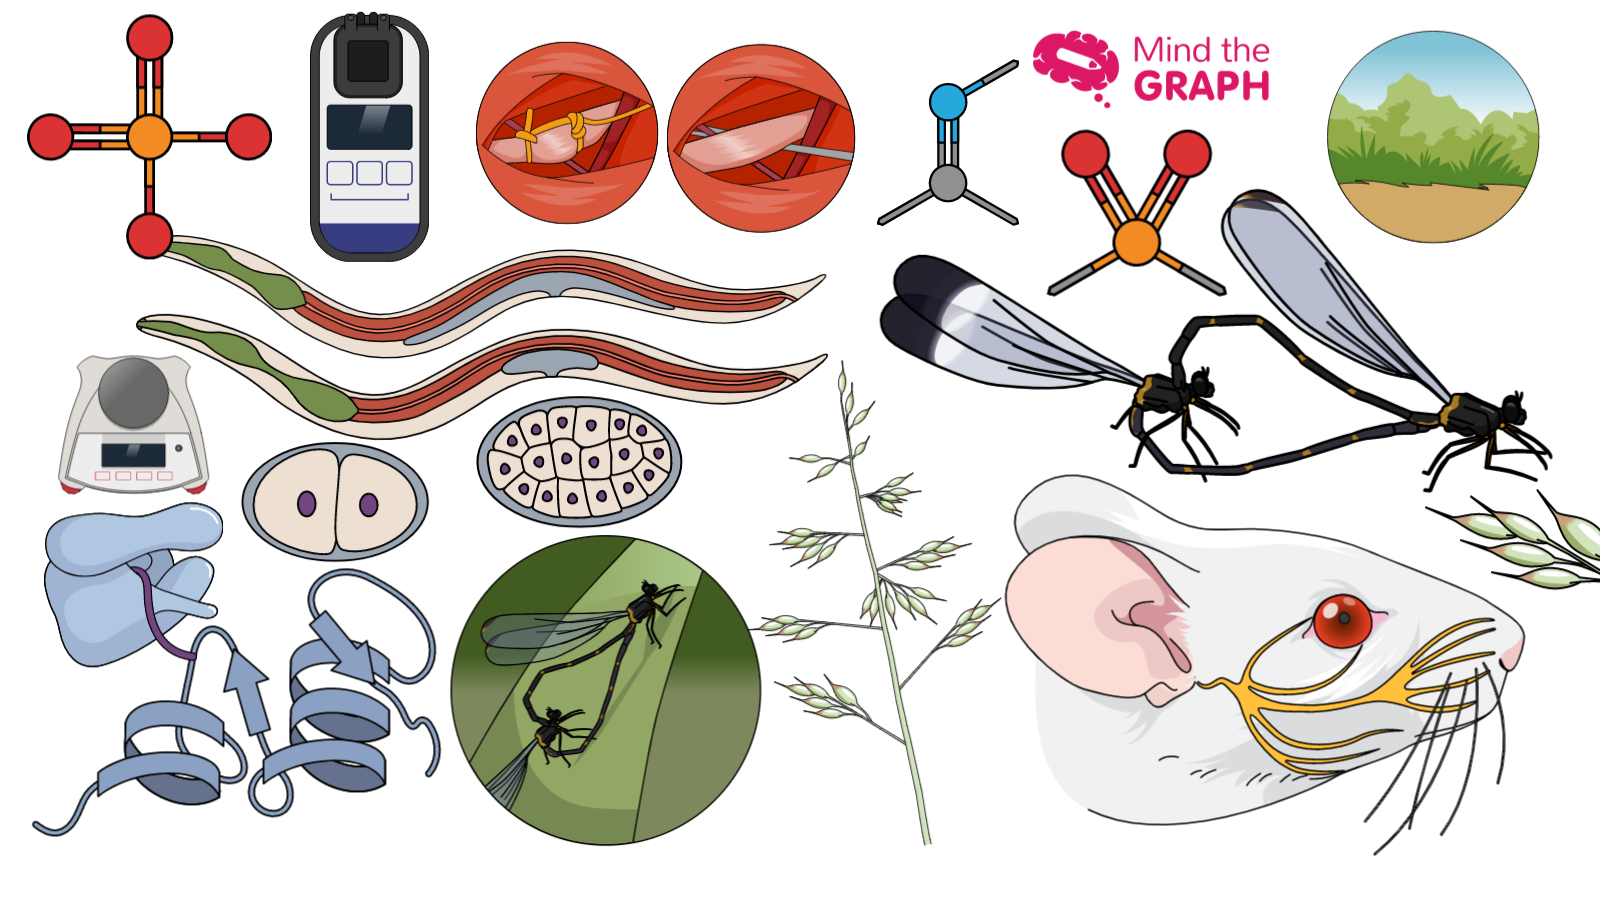
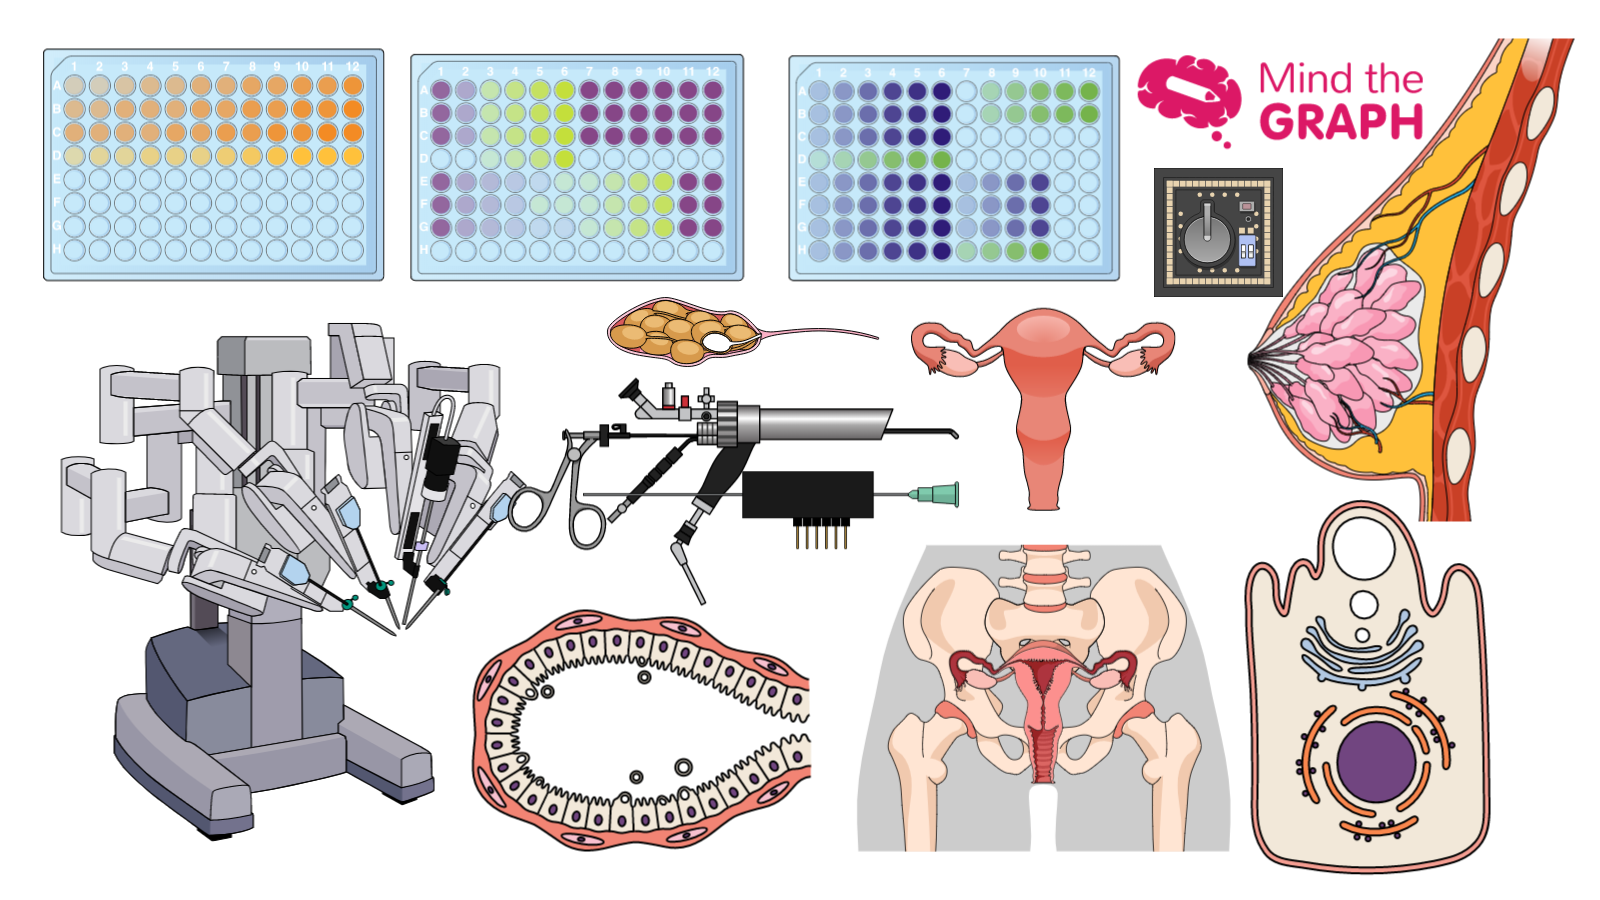
Sexta-feira é o dia em que exibimos nossas novas ilustrações científicas e médicas. Nós já [...]
A ciência pode mudar o mundo. Isto significa que nós, como cientistas, temos um enorme poder. […]
Apanhar e manter a atenção de crianças e adolescentes não é uma tarefa fácil. Mas [...]
Se você é um cientista, médico, estudante ou pesquisador, você sabe que fazer apresentações é [...]
Sexta-feira é o dia em que exibimos nossas novas ilustrações científicas e médicas que permitem [...]
Olá! Sexta-feira é um dia para mostrar as novas ilustrações científicas. Esta semana, acrescentamos várias [...]
Você está explicando a ciência e tópicos científicos complexos de uma maneira compreensível? Não é um [...]
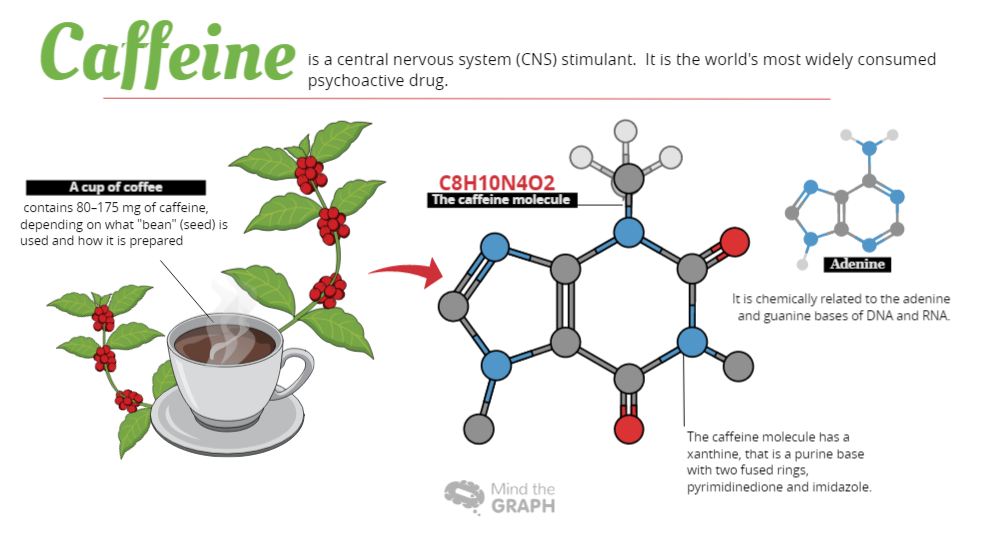
Você tomou um café esta manhã? Uma parte da vida social de um cientista é [...]
Olá, é hora de mostrar as novas ilustrações científicas do Mind the Graph. Já temos [...]
Para comunicar a importância da ciência em nossa sociedade, precisamos primeiro ser capazes de [...]
Como você sabe, todos como sextas-feiras compartilhamos como novas ilustrações que adicionamos no Mind the [...]