2 minutos de leitura
12/06/2019
Mind The Graph Scientific Blog foi criado para ajudar os cientistas a aprender a comunicar a ciência de uma forma descomplicada.
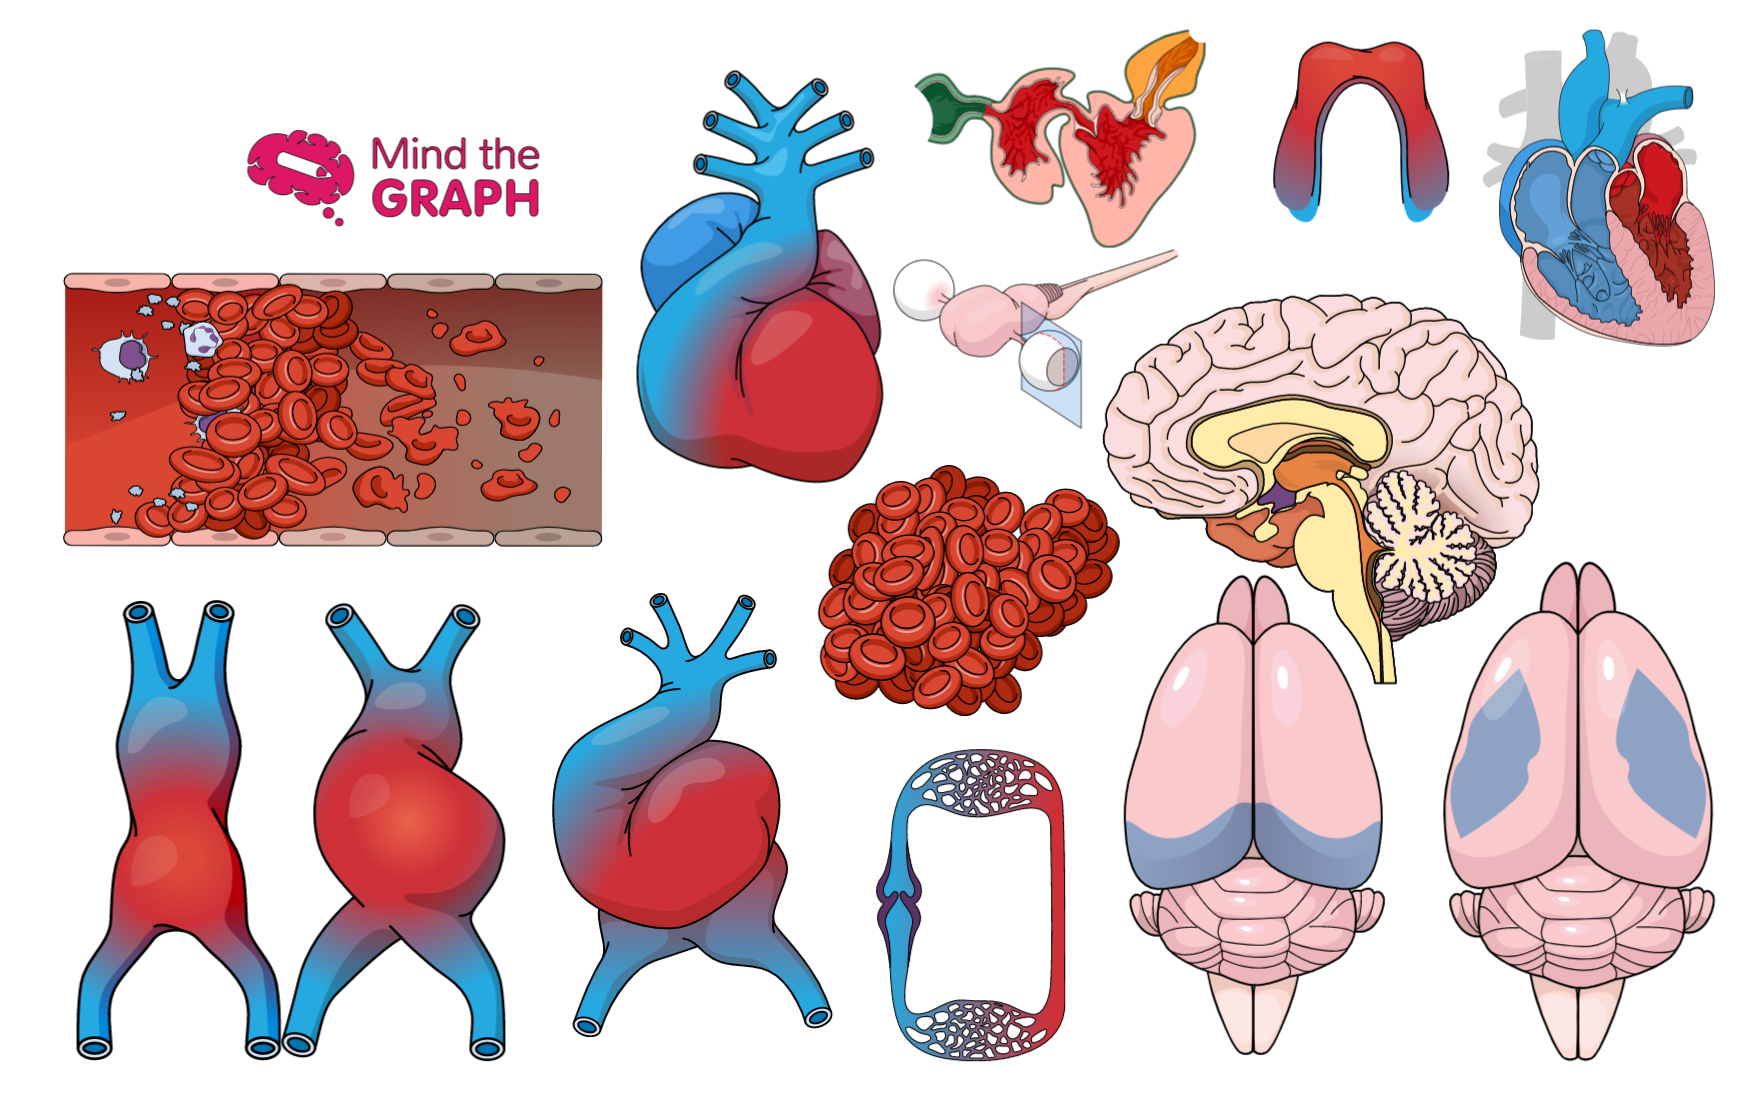
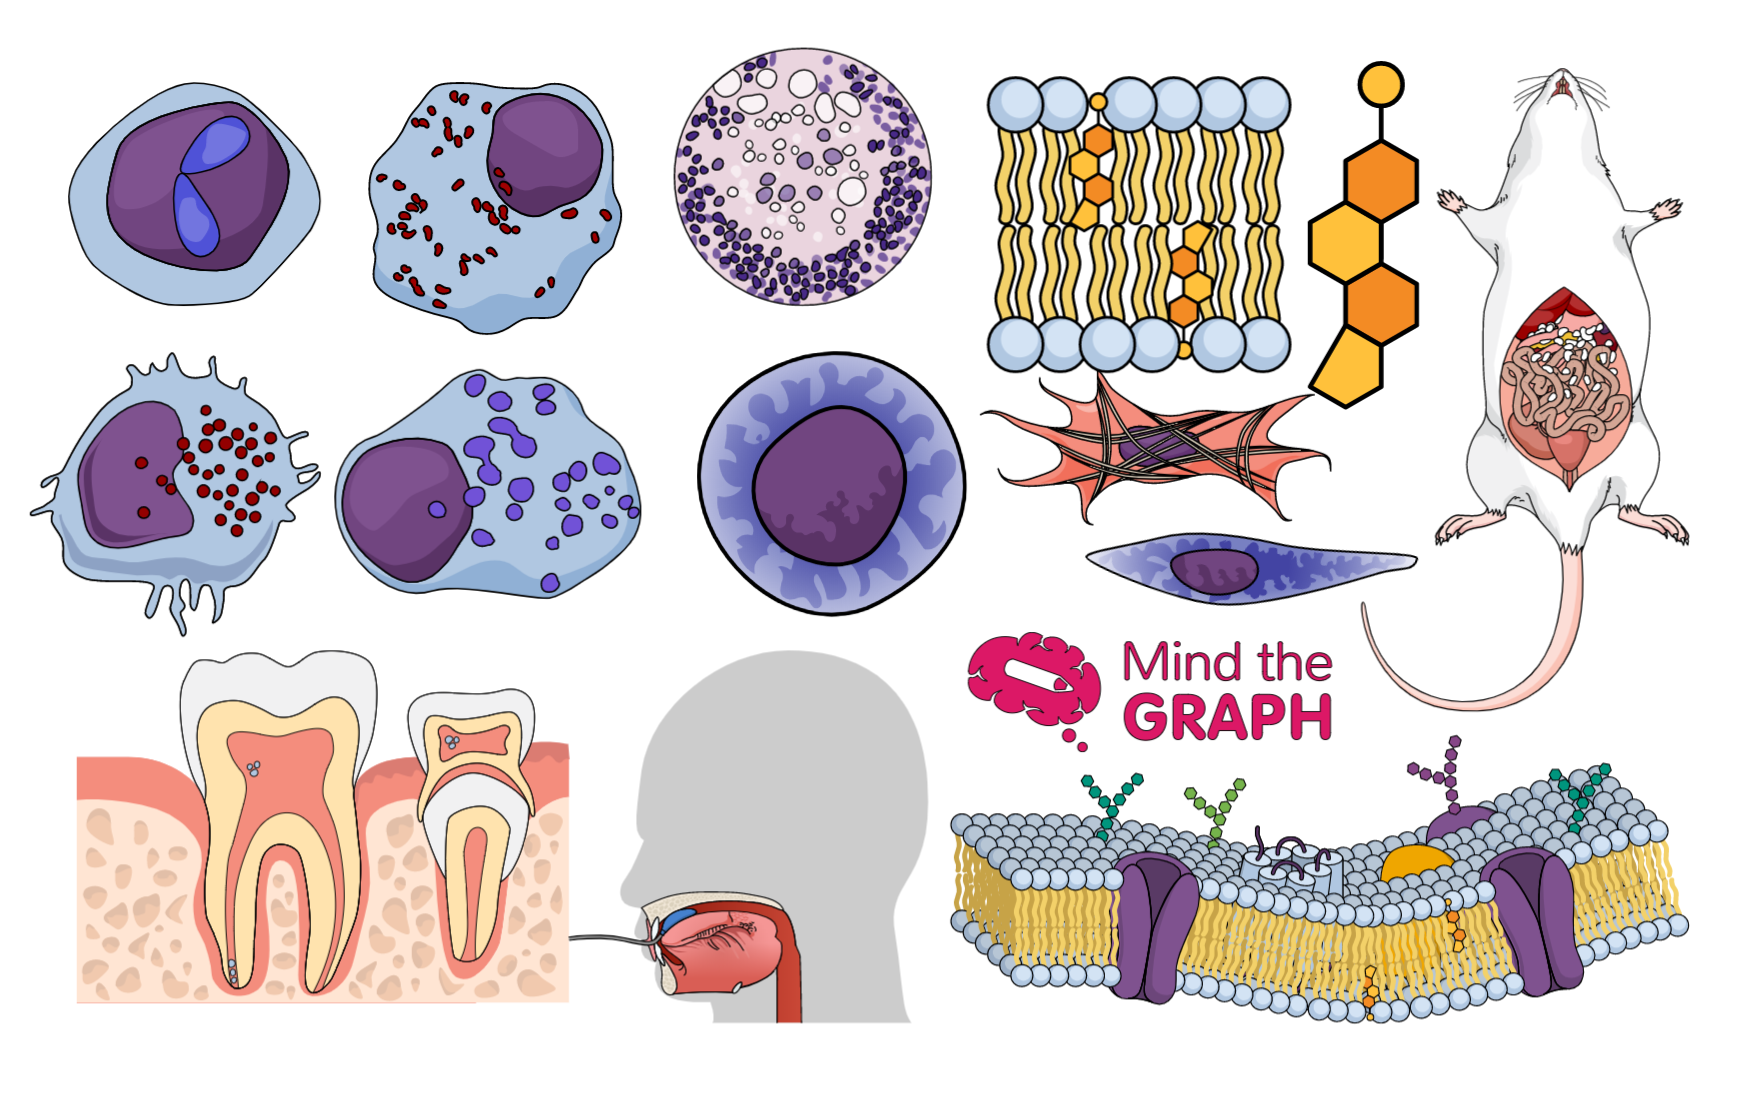
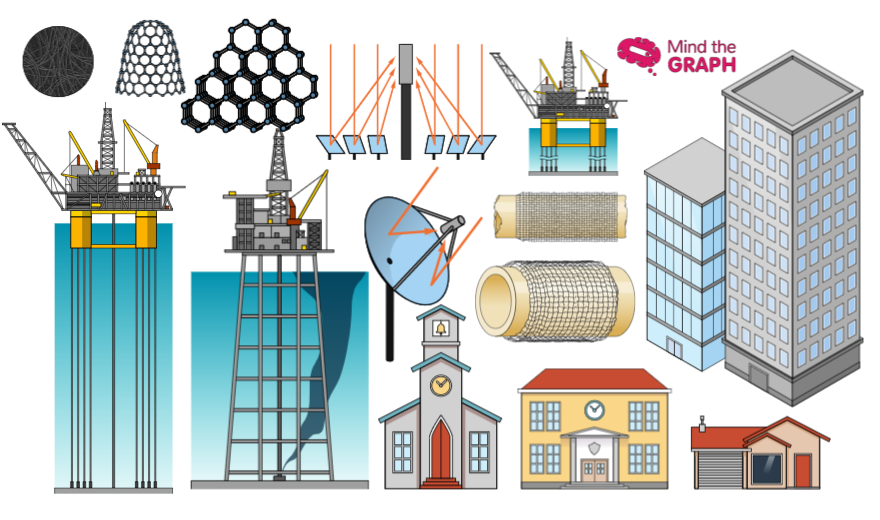
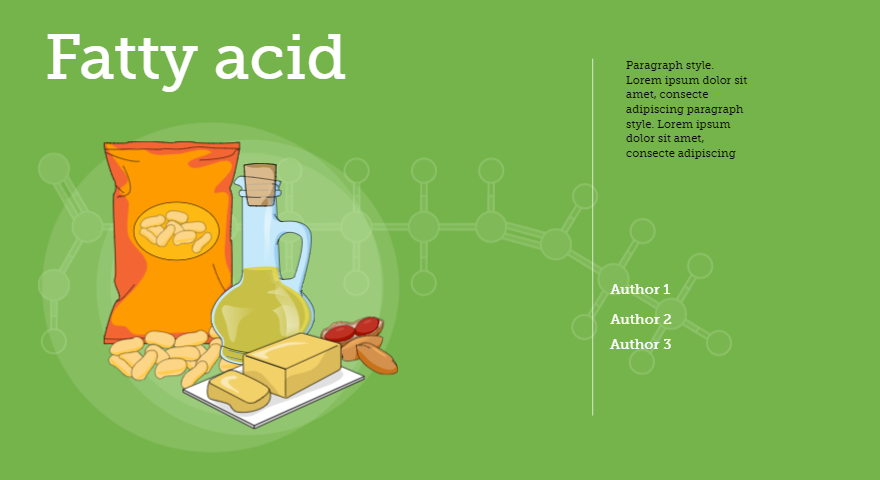
Olá! Como vocês devem saber, sexta-feira é o dia de compartilhar as novas ilustrações científicas. Esta semana adicionamos várias ilustrações exclusivas disponíveis para todos os usuários do gráfico (usuários gratuitos incluídos). Estas figuras abaixo são uma pequena amostra de nossa biblioteca completa. Criamos o maior banco de dados on-line sobre ilustrações científicas. Portanto, confira [...]
Durante os dias 24 e 25 de outubro de 2019, aconteceu no Sindicato das Empresas [...]
Hoje temos uma autora convidada - Maryam Kamal - que é uma designer de fontes duos [...]
Olá! Espero que esteja aproveitando sua sexta-feira! Estou escrevendo para trazer boas notícias: temos muitas [...]
Olá novamente! Como vocês devem saber, a cada semana acrescentamos novas ilustrações à nossa biblioteca. […]
Descubra como criar um resumo gráfico eficaz. Este guia o ajuda a criar um resumo visual atraente para aumentar o impacto da pesquisa.
Olá! Você está animado para o fim de semana? Nós também estamos! Também, sexta-feira é a [...]
Olá, hoje eu trago boas notícias! Como vocês devem saber, fornecemos infográficos e [...]
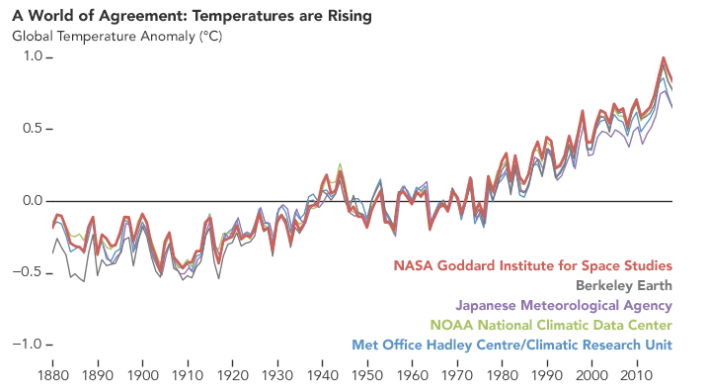
A mudança climática ainda é um assunto polêmico. Às vezes, as evidências científicas desaparecem diante de opiniões pessoais e [...]
Olá! É sexta-feira novamente. Antes de falarmos sobre as expectativas para o fim de semana, [...]
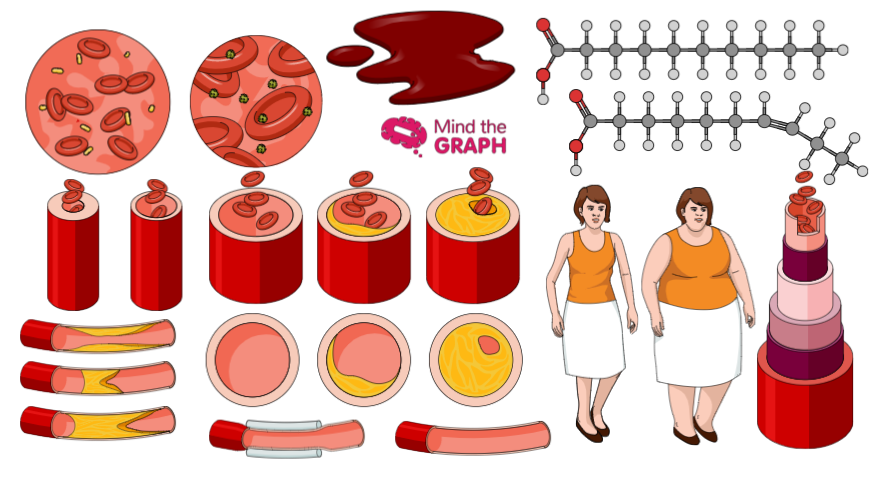
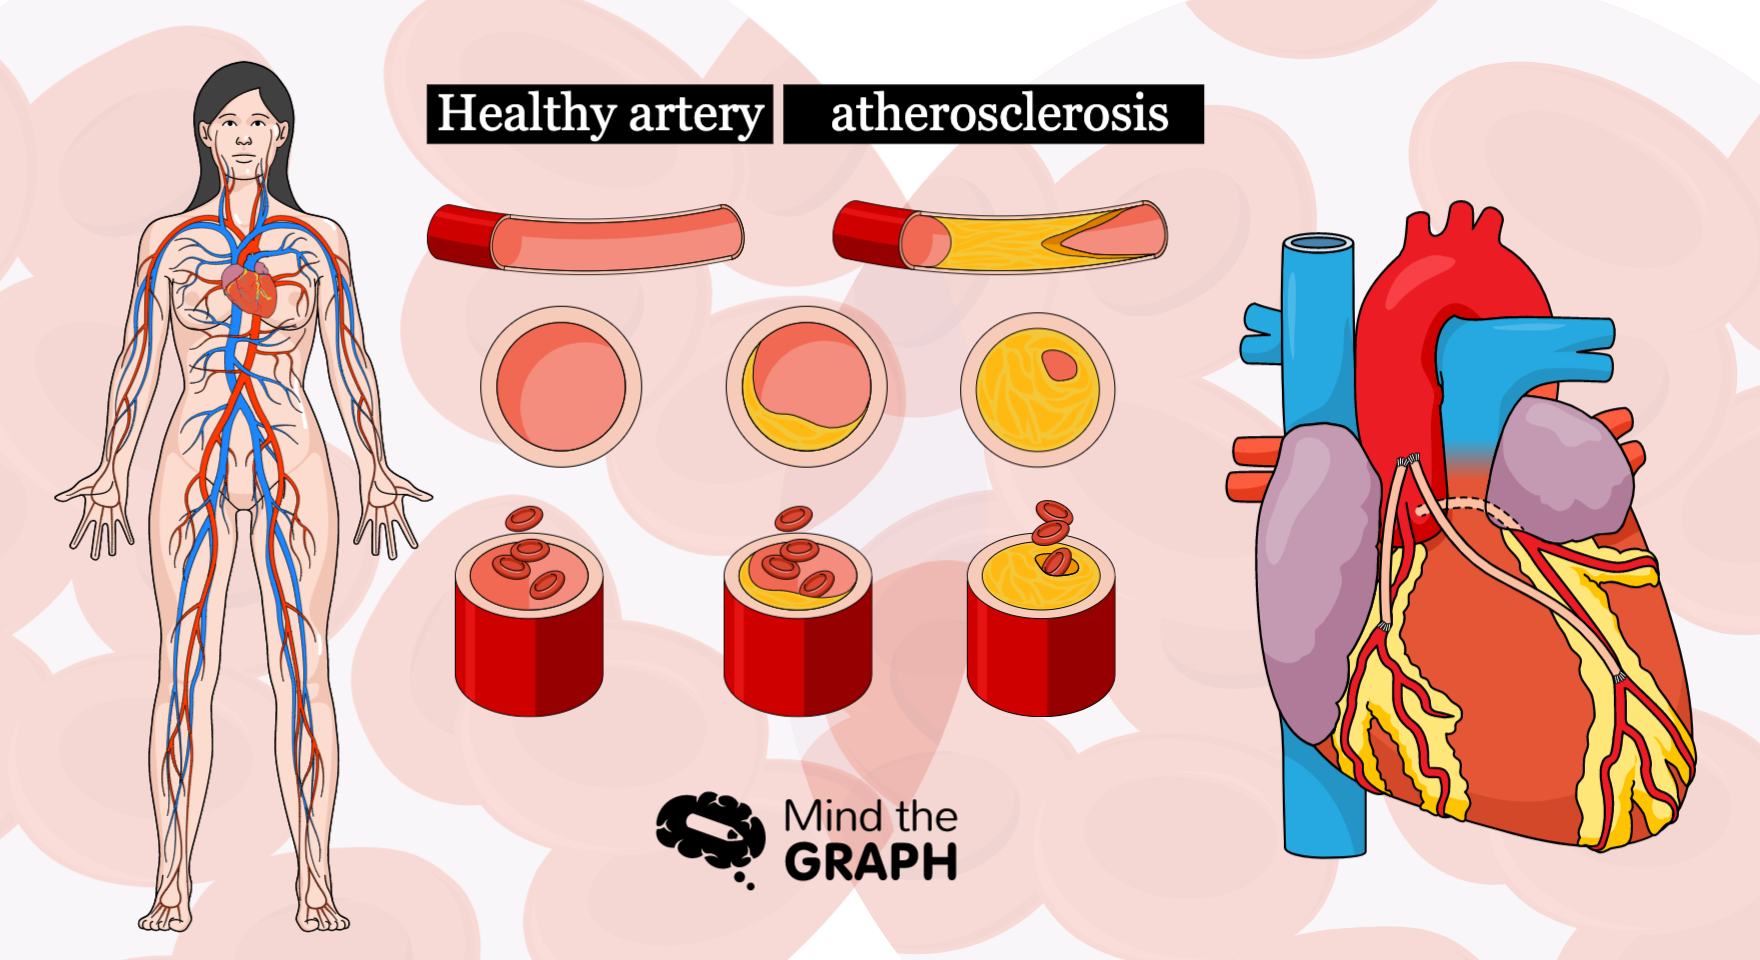
A aterosclerose é uma condição médica do sistema circulatório. Ela acontece quando a placa se acumula dentro [...]
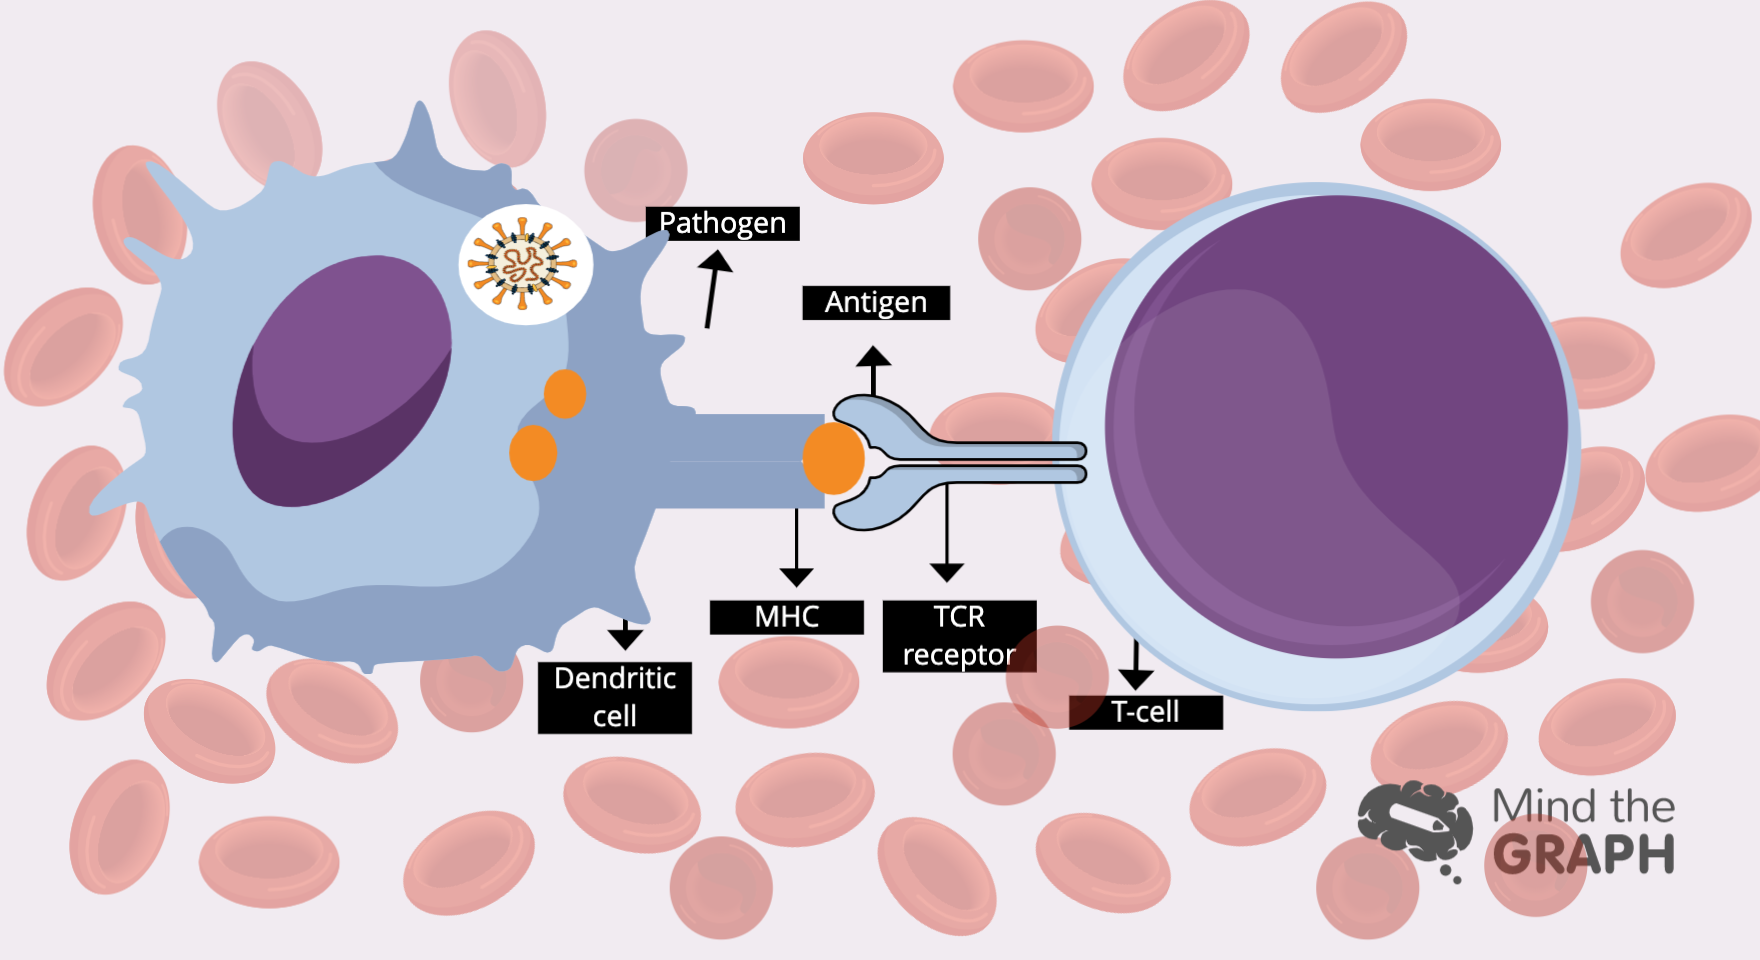
Os glóbulos brancos são responsáveis por defender nosso corpo contra ameaças, mantendo-nos vivos. Mas como [...]
Olá! Sexta é dia de mostrar o melhor da nossa semana. Como você deve saber, [...]