2 minutos de leitura
04/08/2020
Mind The Graph Scientific Blog foi criado para ajudar os cientistas a aprender a comunicar a ciência de uma forma descomplicada.
Eu já tenho uma opinião, mas vamos cobrir todas as teorias disponíveis: 1) A mais óbvia: o sistema de saúde na Alemanha está mais bem equipado 2) Os alemães estão usando tratamentos inovadores 3) A Alemanha ainda está nos primeiros dias do surto, portanto não houve "tempo suficiente" para que a taxa de mortalidade se estabilizasse E [...]
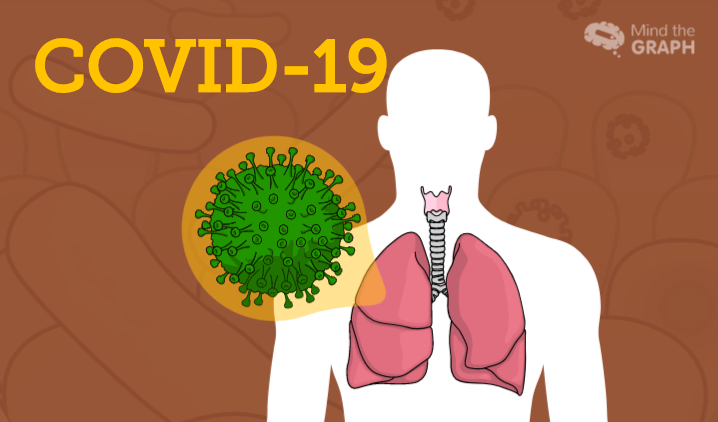
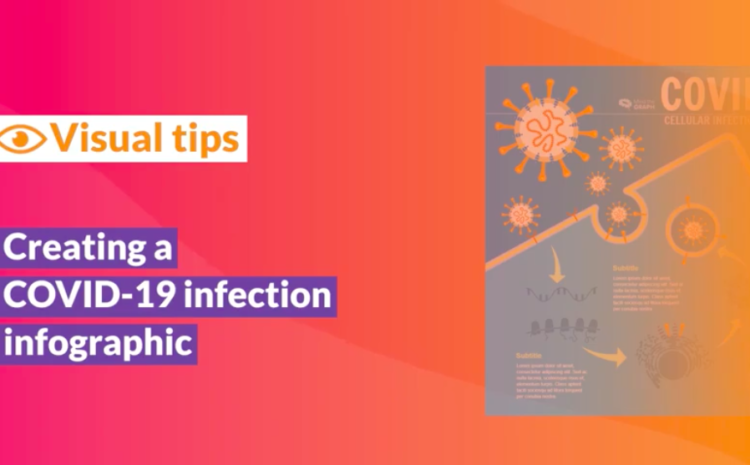
3) Da perspectiva celular, o mecanismo coronavírus da infecção reconhece os receptores ACE2 nos [...]
Como mencionamos no primeiro post desta série sobre o coronavírus, o rythm [...]
A história de sua descoberta é que Fleming havia investigado as propriedades dos estafilococos. […]
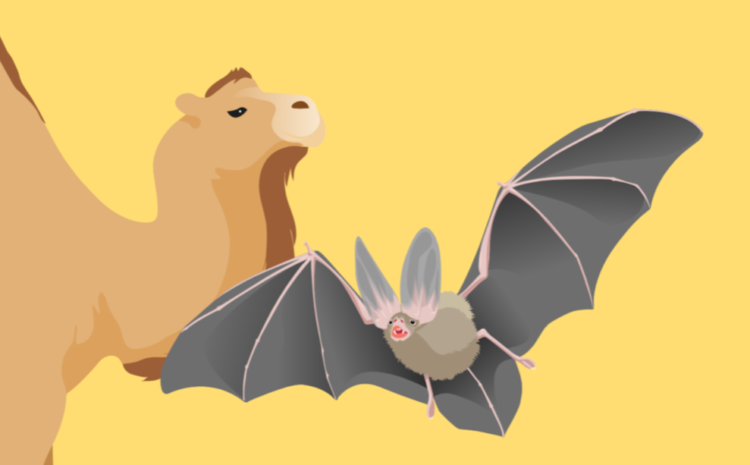
O mundo está enfrentando uma grande crise sanitária. Em meio à nova pandemia de Coronavirus, a primeira [...]
Se você precisa de figuras científicas, aqui é o lugar, temos literalmente milhares de [...] científicos [...
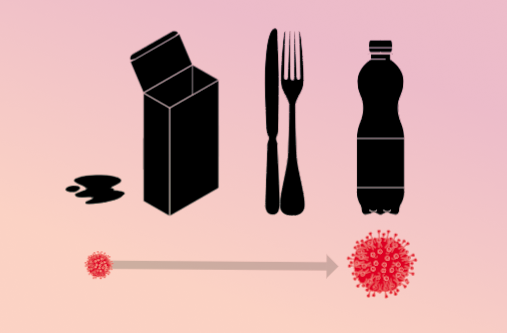
Esta é uma pergunta intrigante. Se você fosse um detetive tentando encontrar o coronavírus [...]
Apesar de o número total de casos ser exatamente o mesmo, achatando os [...]