2 minutos de leitura
10/24/2018
Mind The Graph Scientific Blog foi criado para ajudar os cientistas a aprender a comunicar a ciência de uma forma descomplicada.
Como capacitar sua pesquisa em Ciências da Vida com resumos gráficos? Não é fácil criar imagens precisas e belas de caminhos de sinalização celular. Entretanto, como já escrevi sobre como a maioria das revistas Cell Press pede um Resumo Gráfico e como isto pode ser uma barreira se você é um cientista, mas não um designer. […]
Ilustrações e infografias são ótimas ferramentas para mostrar dados e falar sobre temas controversos como [...]
As crianças em geral têm uma mente curiosa e tantas perguntas. Exatamente como os cientistas devem ser. Portanto, [...]
Às vezes, recebo e-mails de cientistas, engenheiros, professores e outros profissionais dizendo: Oh, eu amo [...]
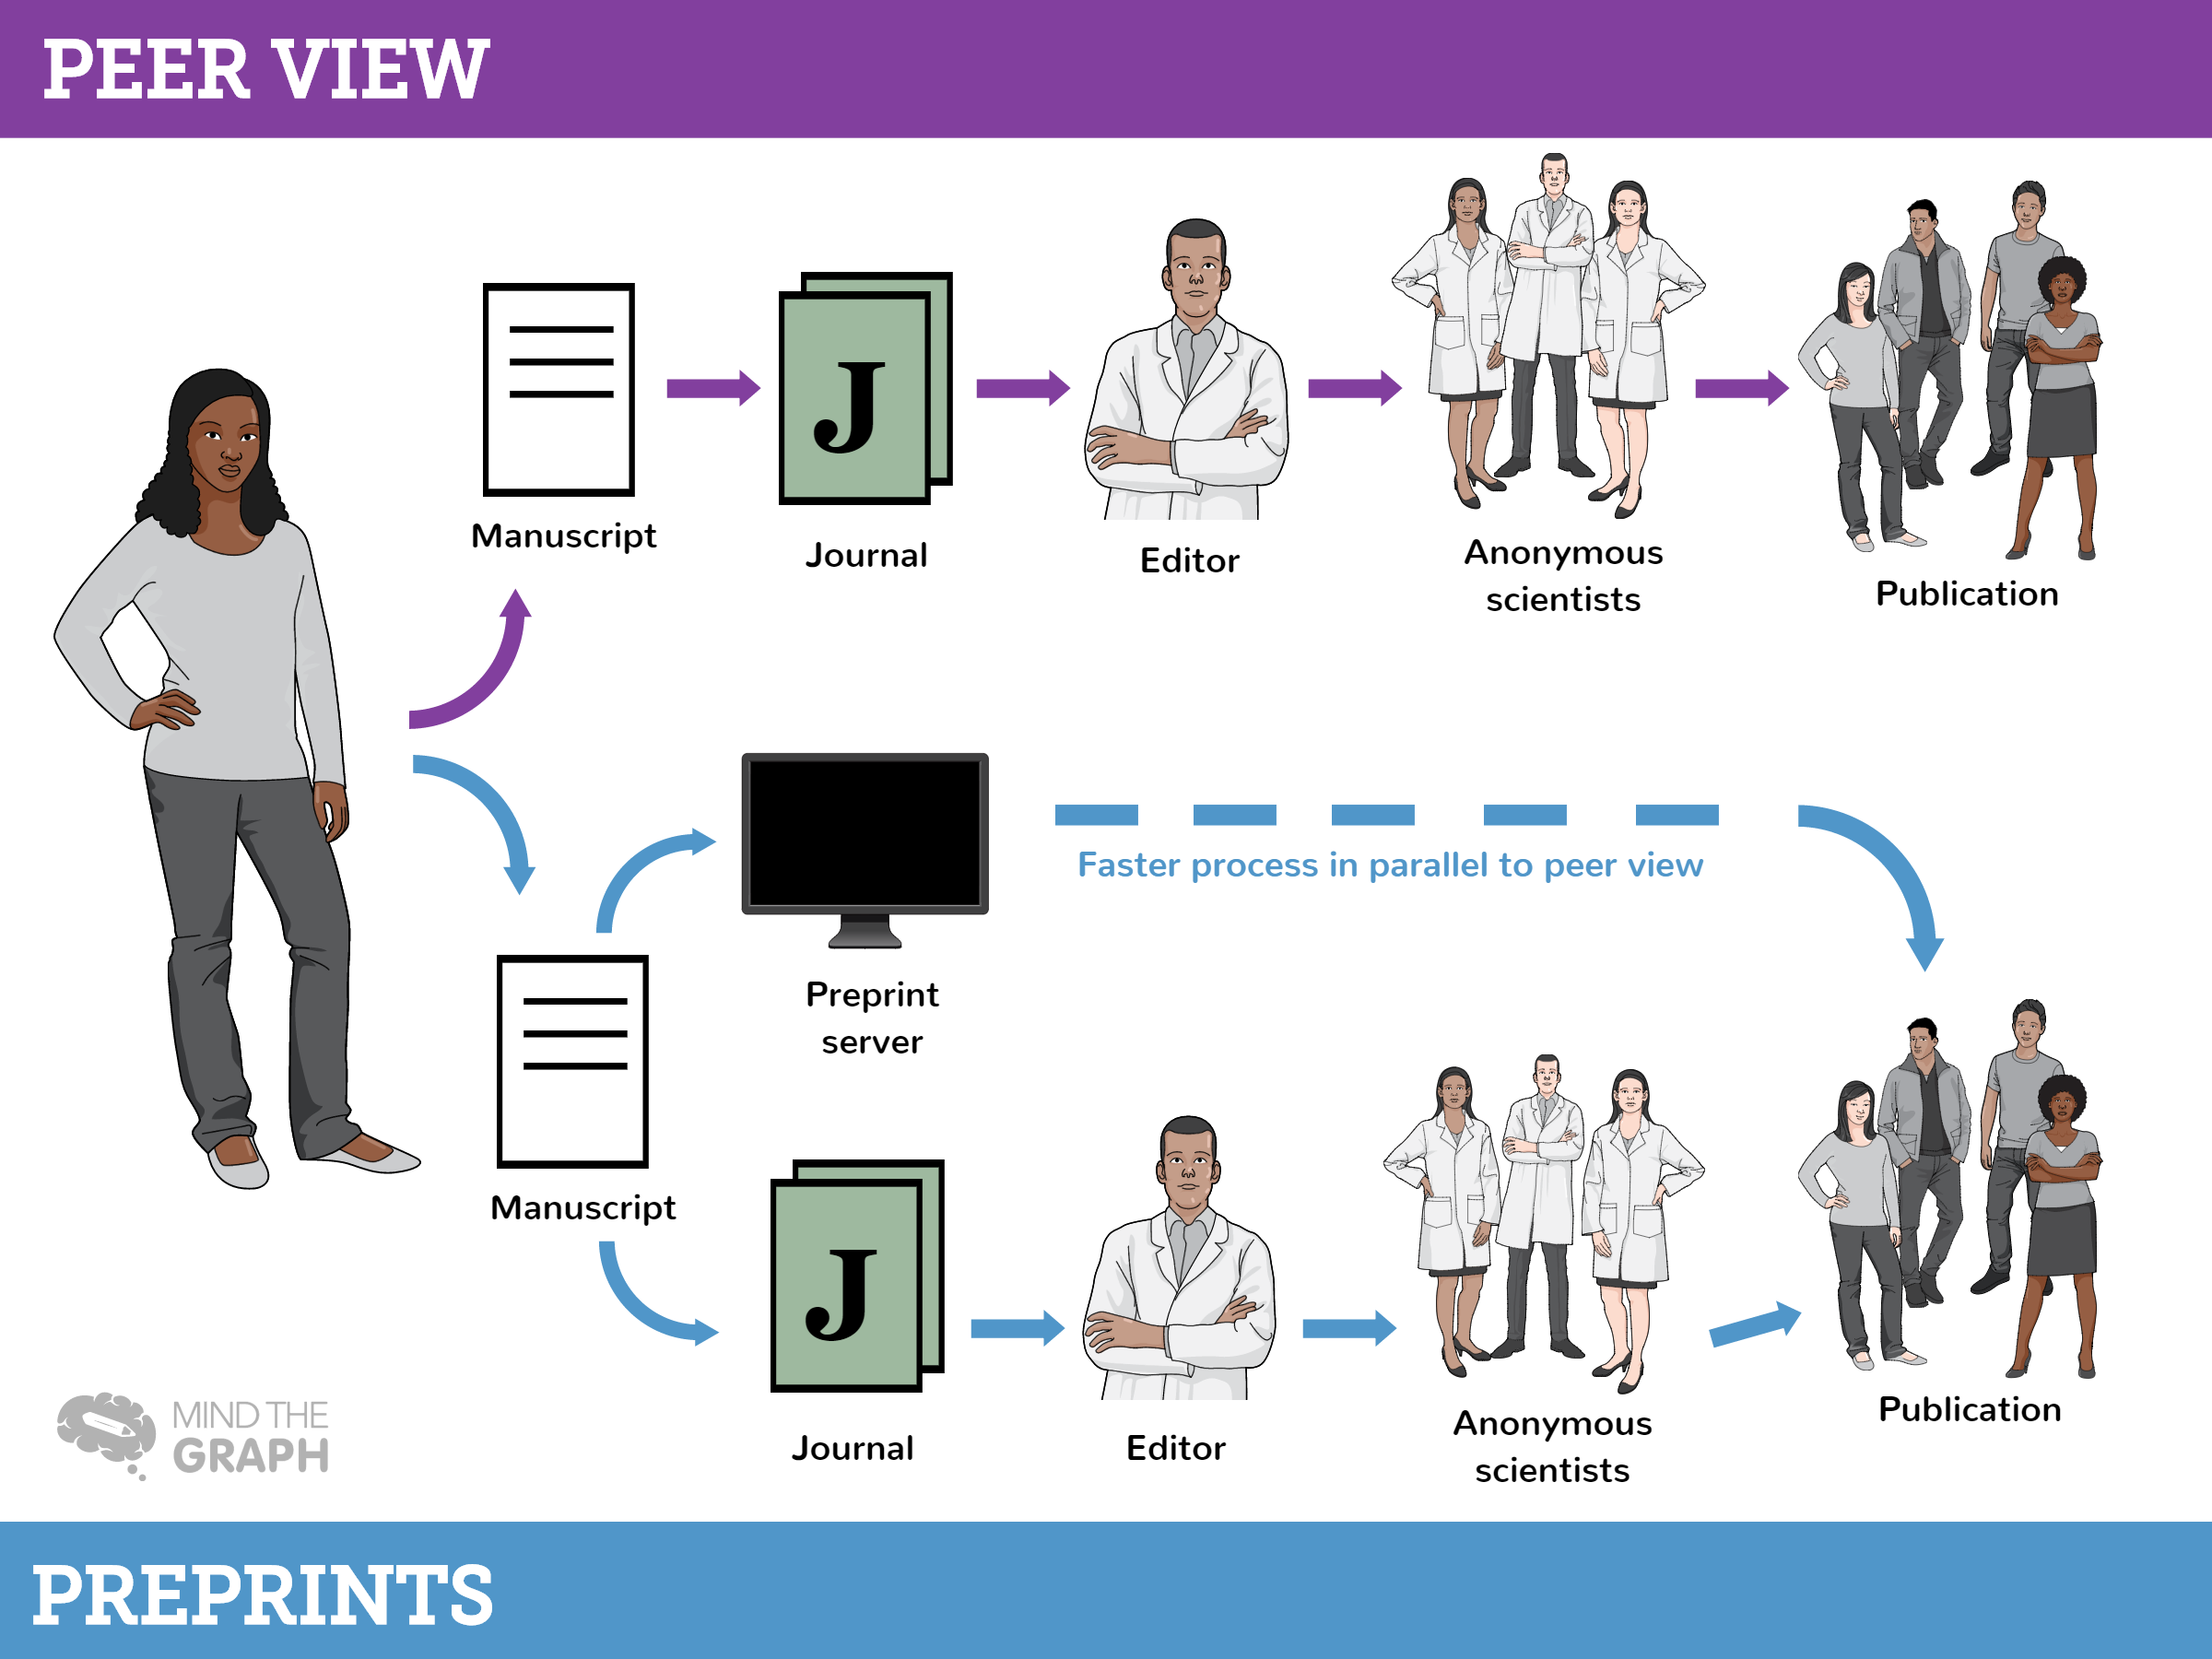
Publicação científica. Somente um pesquisador pode entender a sensação mista de ouvir estas palavras. Em [...]
A comunicação científica nem sempre foi destinada a ser publicada em revistas. Desde o início da ciência, [...]
Para nossa absoluta surpresa, o Mind the Graph foi recentemente apresentado em um post sobre estratégias significativas de marca digital.
Todos os dias estamos sobrecarregados com informações em todos os formatos. Nunca foi tão fácil [...]
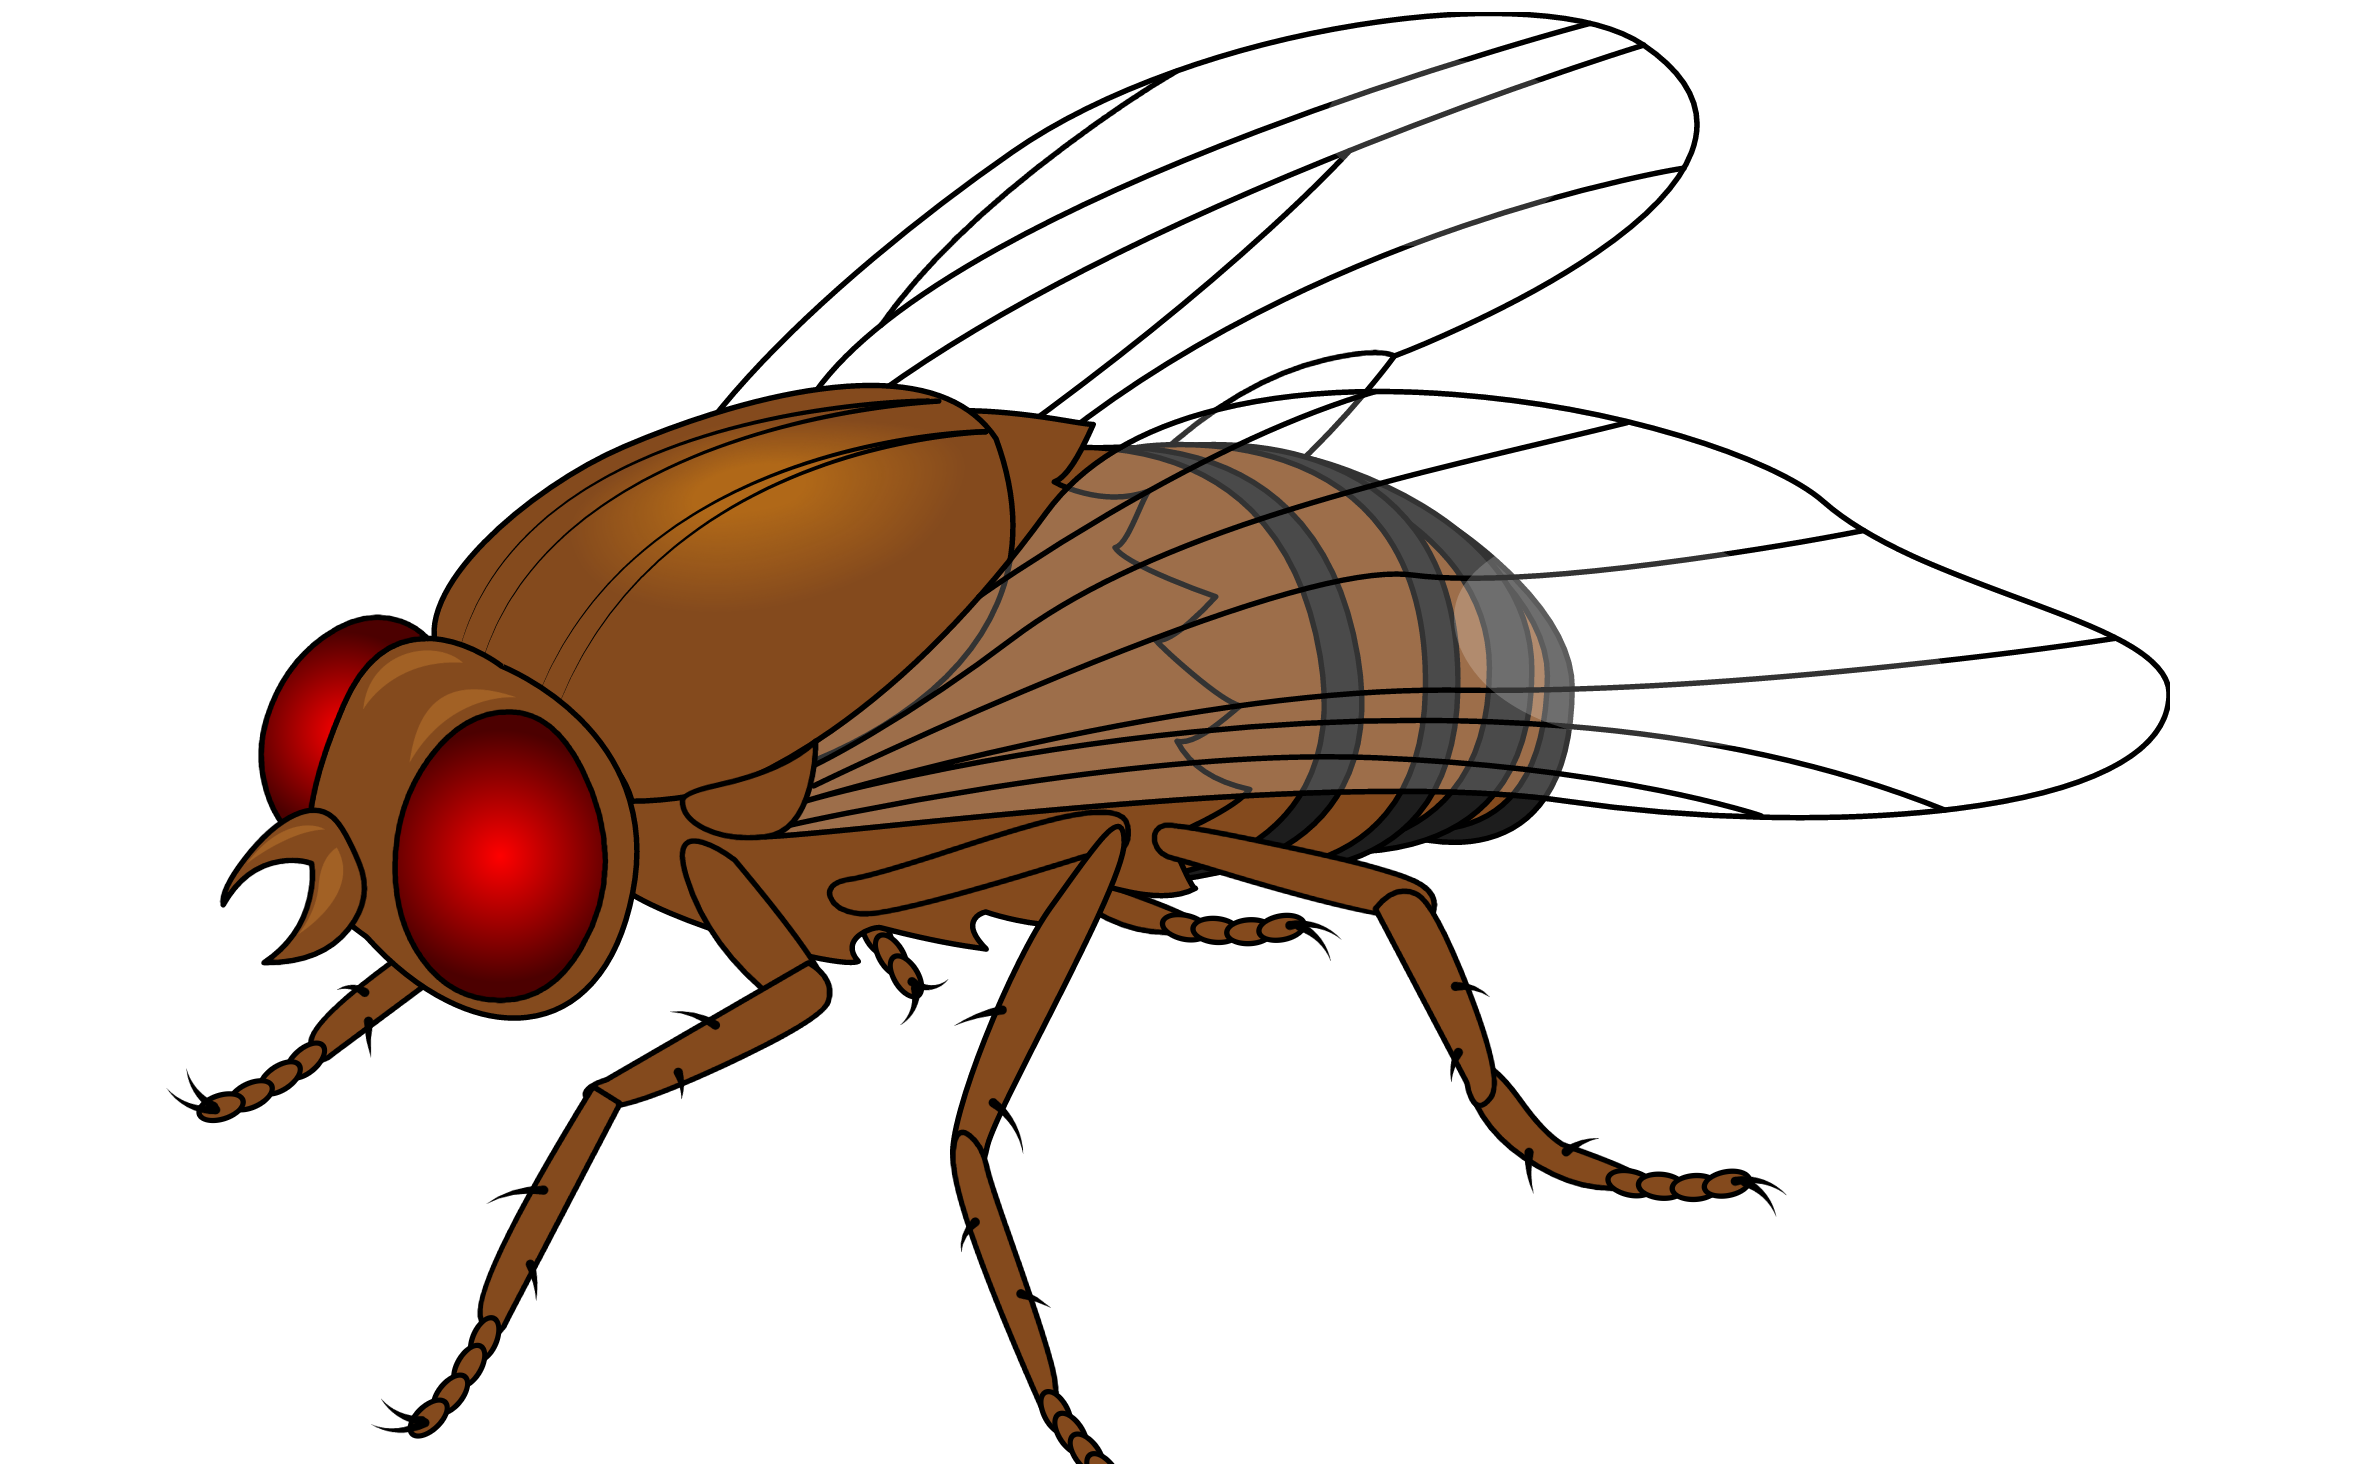
Drosophila melanogaster ou mosca da fruta é um dos modelos mais importantes em medicina e [...]
E se você pudesse transmitir sua pesquisa para milhões de pessoas e fazer seu trabalho [...]
O formato do artigo científico foi uma revolução na ciência. Antes disso, a comunicação científica era feita [...]
Publicar um artigo que ninguém jamais lerá não é divertido. Em vez disso, ele é [...]
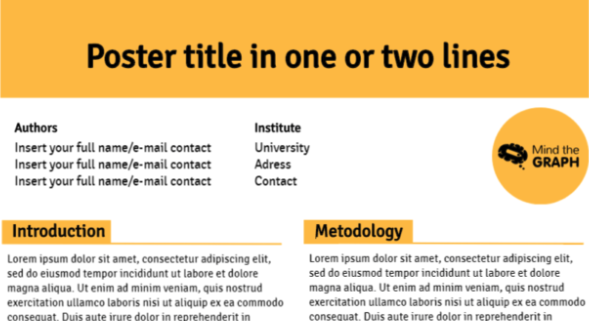
Apresentar um cartaz científico é uma forma comum de comunicar uma pesquisa científica. É um [...]