1 min. lido
07/26/2019
Mind The Graph Scientific Blog foi criado para ajudar os cientistas a aprender a comunicar a ciência de uma forma descomplicada.
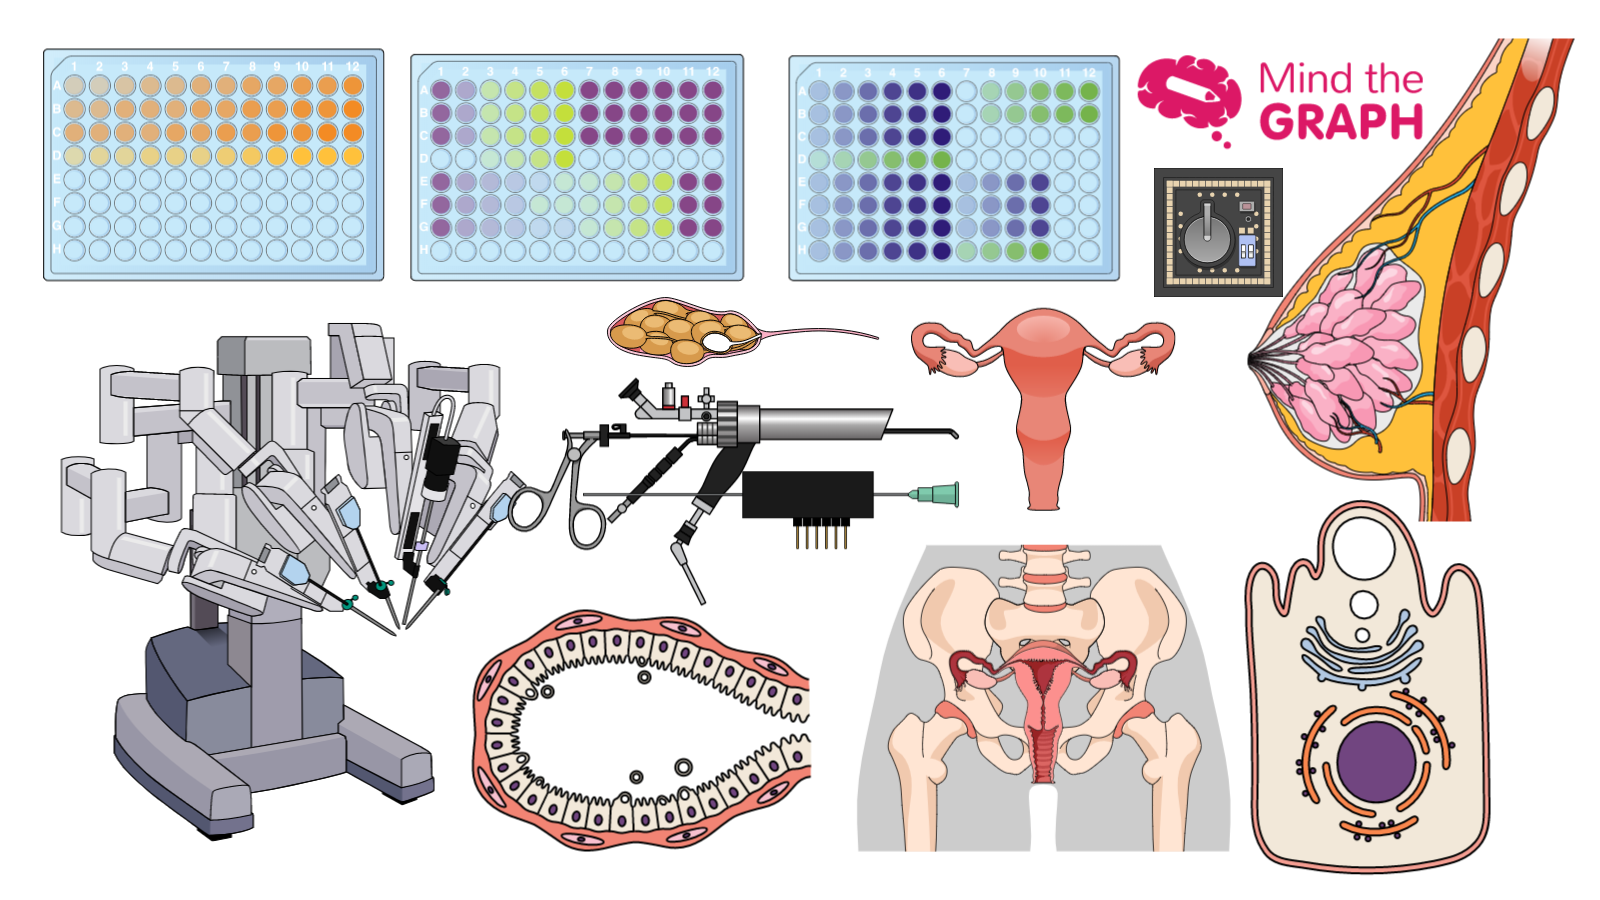
Sexta-feira é o dia em que exibimos nossas novas ilustrações científicas e médicas. Já temos mais de oito mil ilustrações em nossa biblioteca que estão disponíveis para todos os usuários de gráficos (incluindo usuários gratuitos). Com estas ilustrações você pode criar resumos gráficos, infográficos, trabalhos, cartazes, aulas e tudo o que desejar. Portanto, se você se preocupa com o [...]
A ciência pode mudar o mundo. Isto significa que nós, como cientistas, temos um enorme poder. […]
Apanhar e manter a atenção de crianças e adolescentes não é uma tarefa fácil. Mas [...]
Se você é um cientista, médico, estudante ou pesquisador, você sabe que fazer apresentações é [...]
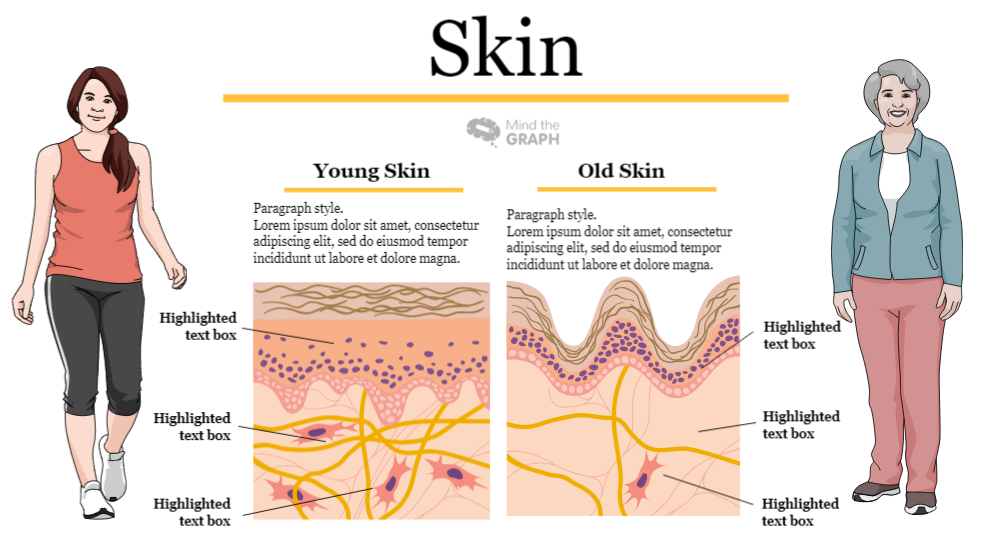
Sexta-feira é o dia em que exibimos nossas novas ilustrações científicas e médicas que permitem [...]
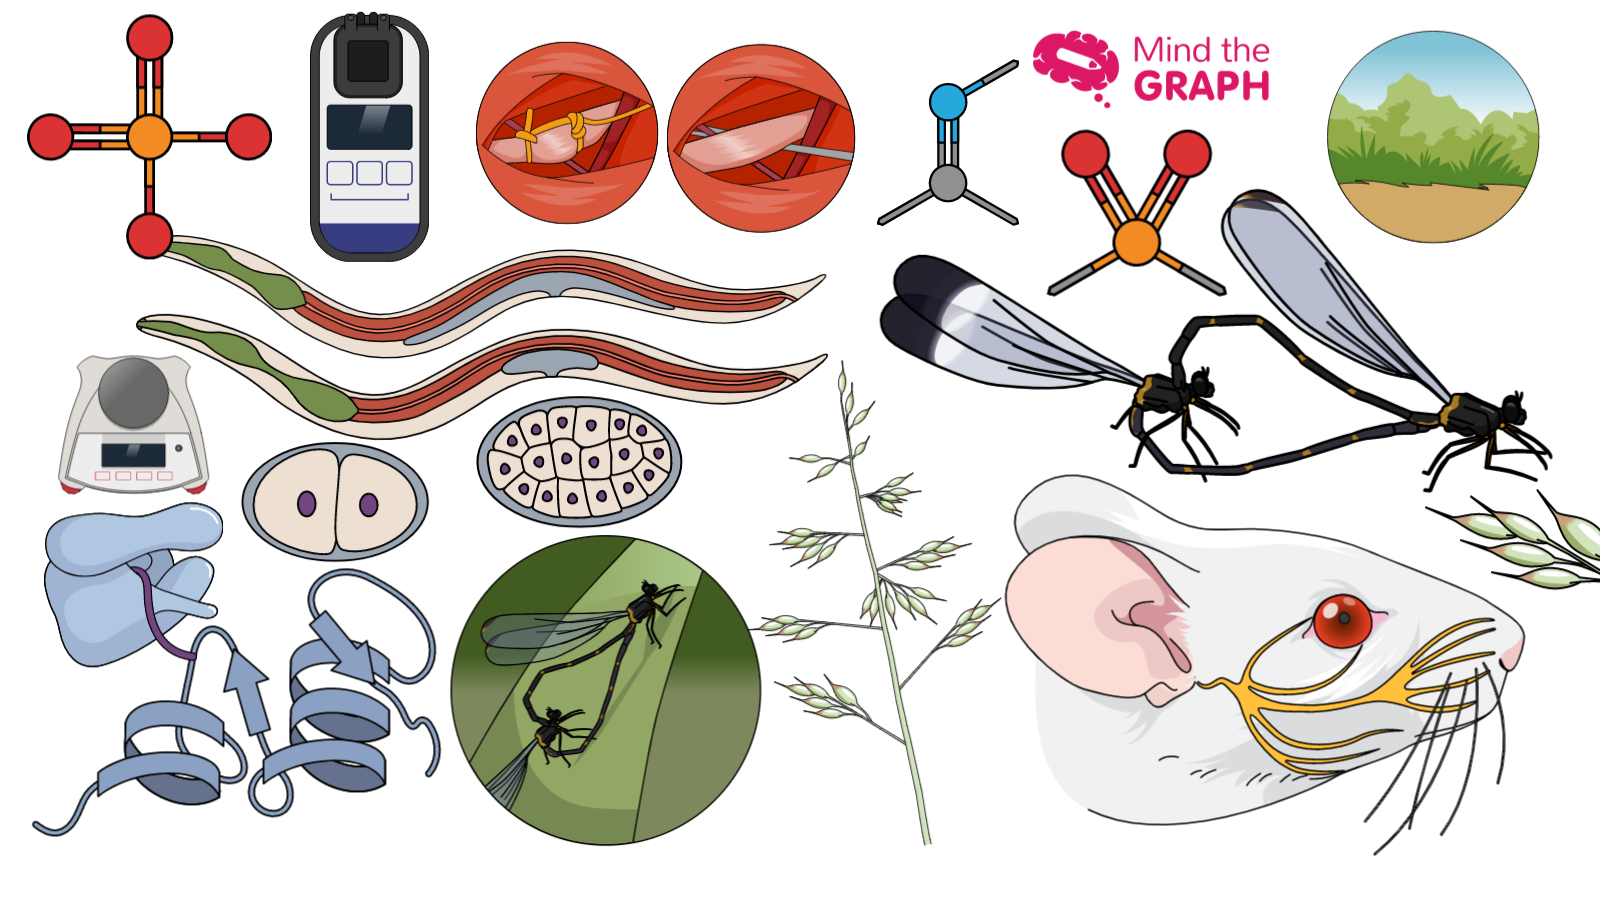
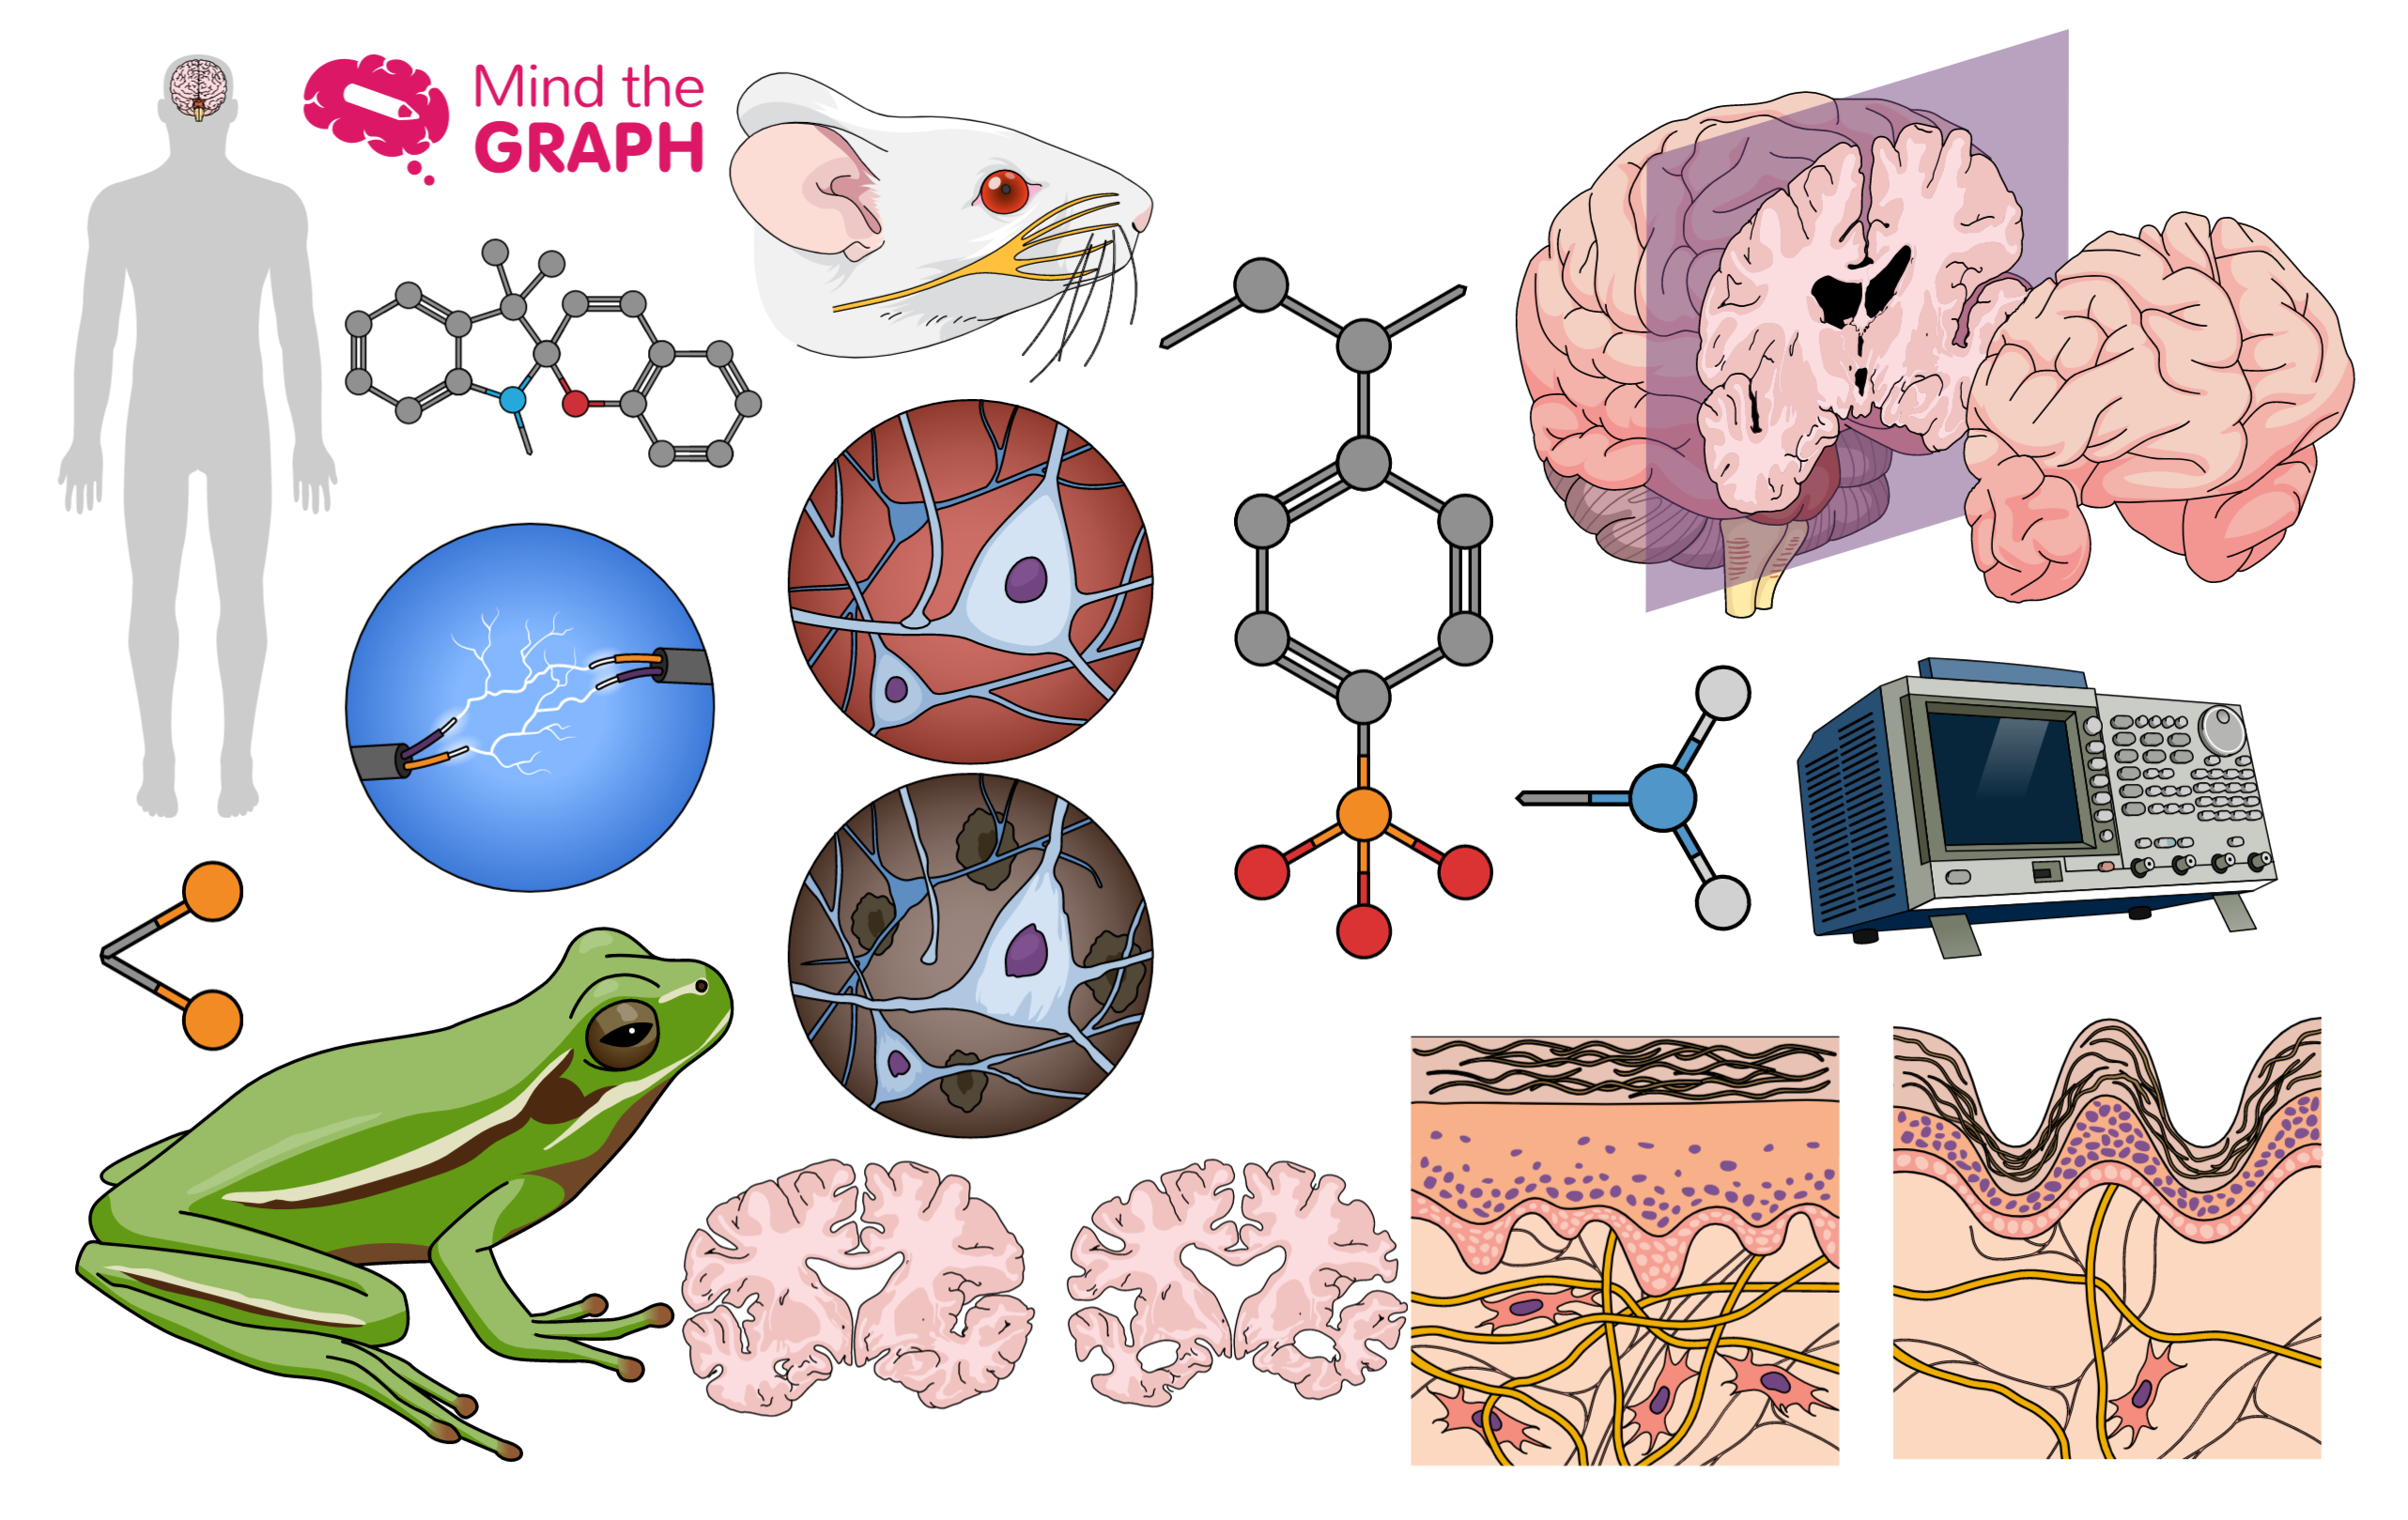
Olá! Sexta-feira é um dia para mostrar as novas ilustrações científicas. Esta semana, acrescentamos várias [...]
Você está explicando a ciência e tópicos científicos complexos de uma maneira compreensível? Não é um [...]
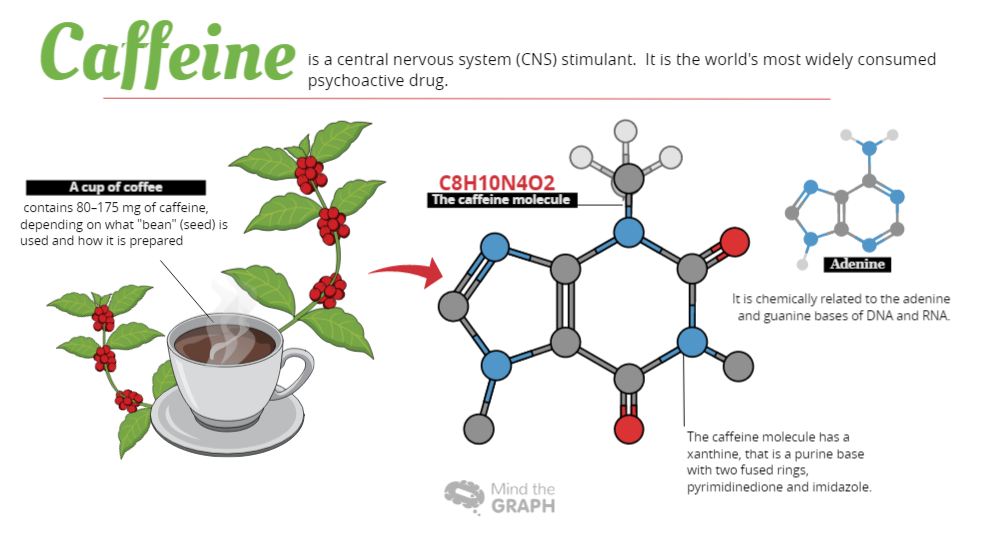
Você tomou um café esta manhã? Uma parte da vida social de um cientista é [...]
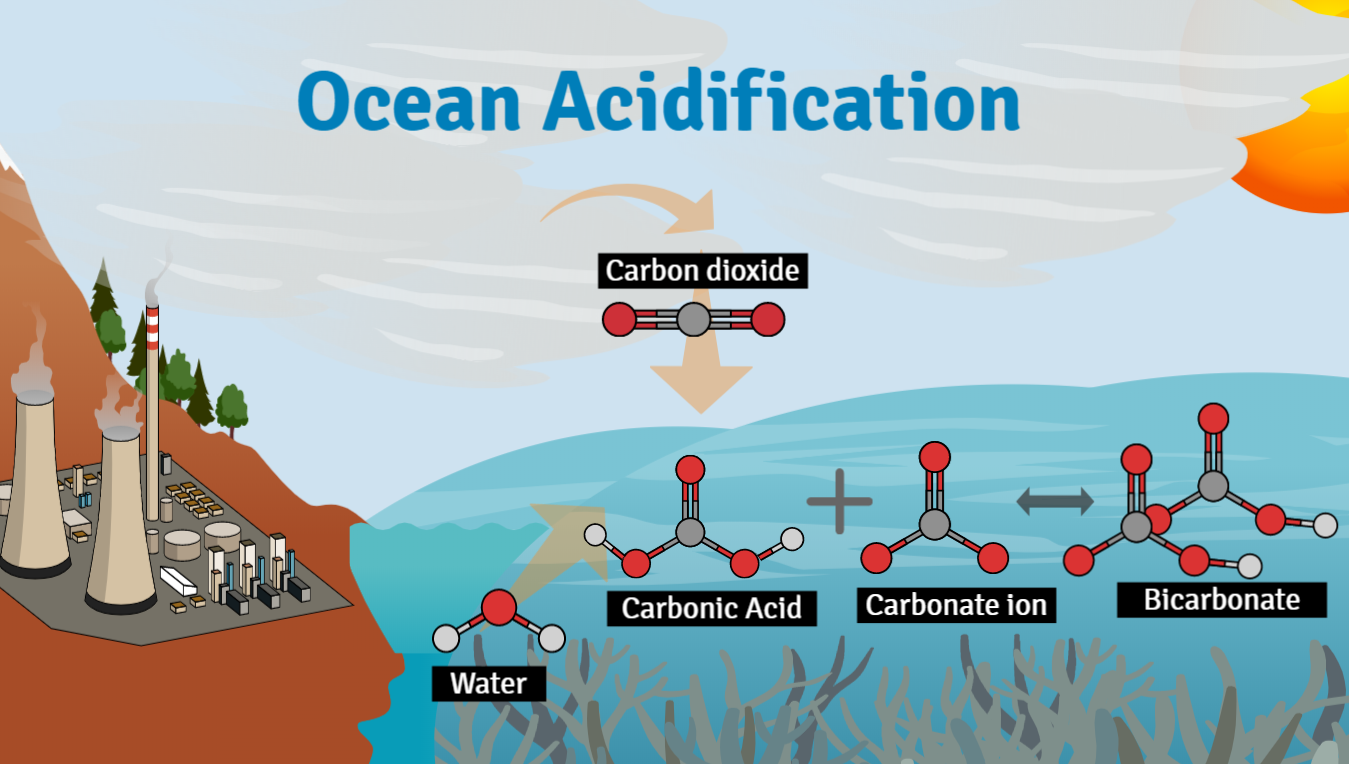
Olá, é hora de mostrar as novas ilustrações científicas do Mind the Graph. Já temos [...]
Para comunicar a importância da ciência em nossa sociedade, precisamos primeiro ser capazes de [...]
Como você sabe, todos como sextas-feiras compartilhamos como novas ilustrações que adicionamos no Mind the [...]
Como você provavelmente sabe, o Mind the Graph é uma plataforma online que permite aos cientistas [...]
Olá! É sexta-feira novamente (YAY). Você está correndo para o fim de semana? Ou você [...]