2 min lesning
12/06/2019
Vitenskapsbloggen Mind The Graph er ment å hjelpe forskere med å lære å kommunisere vitenskap på en ukomplisert måte.
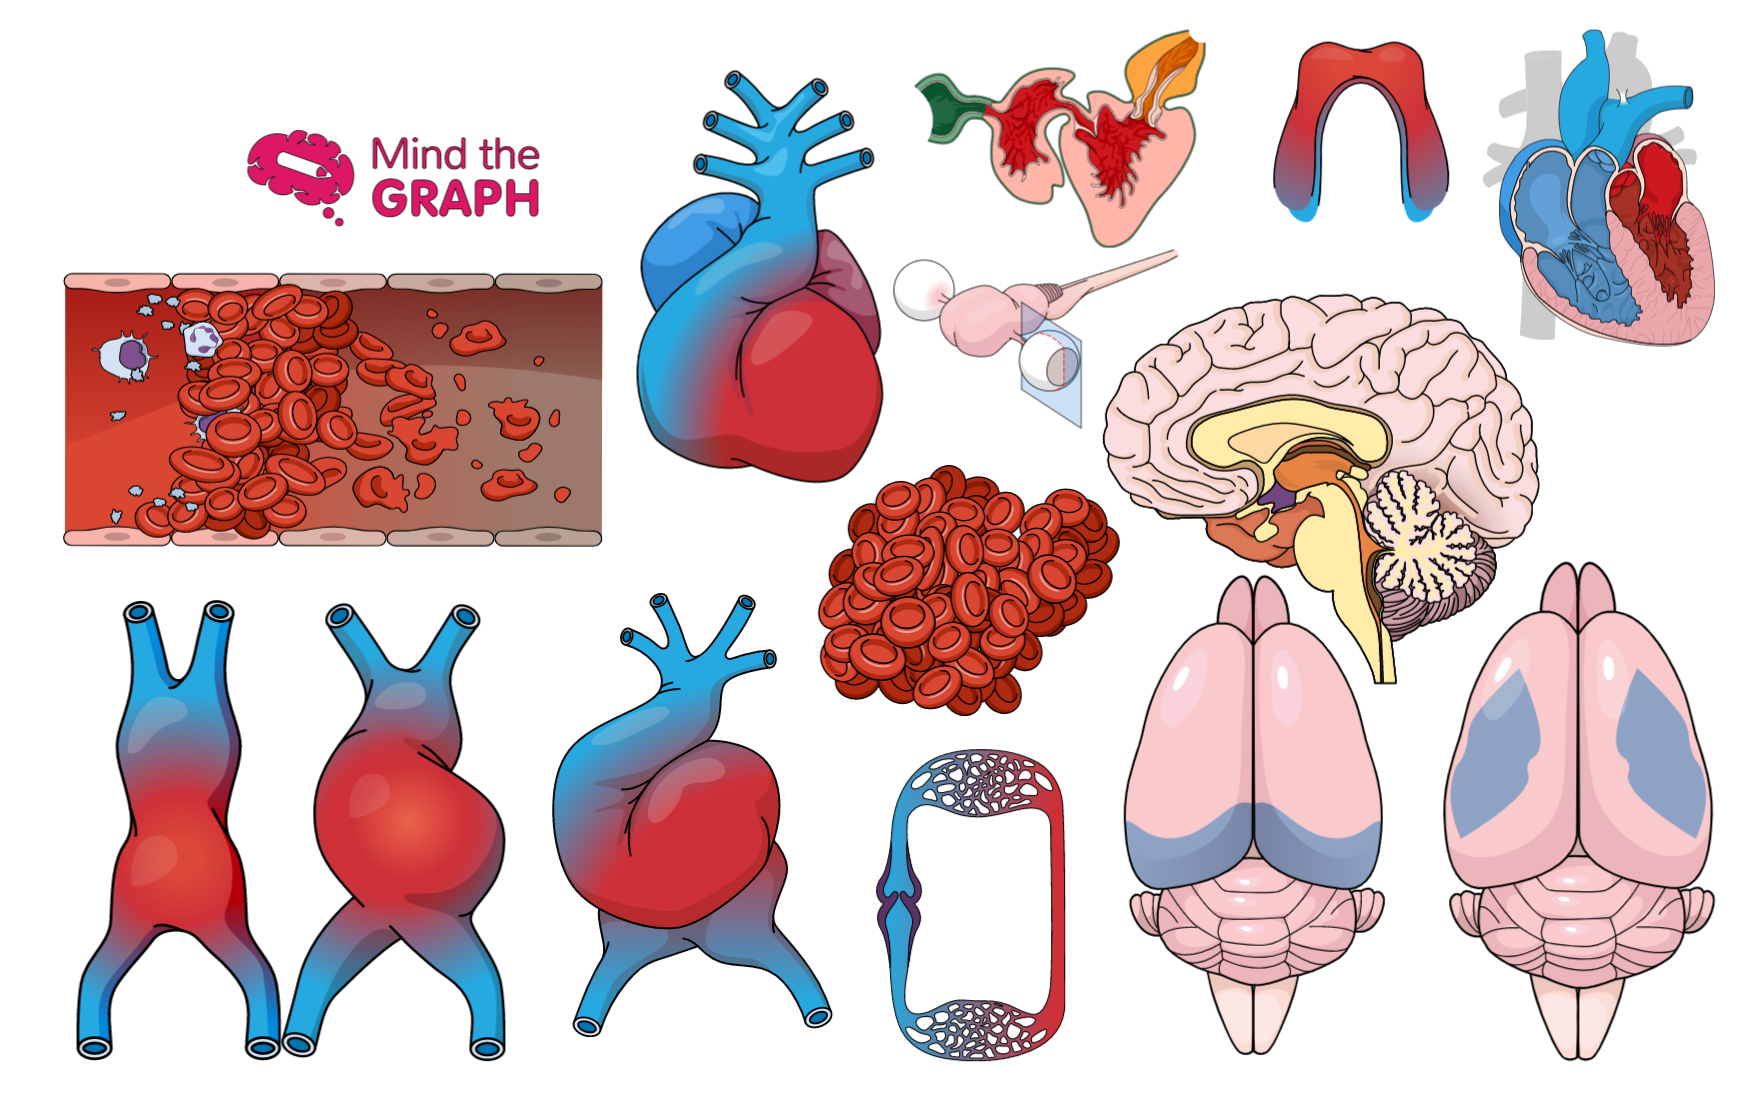
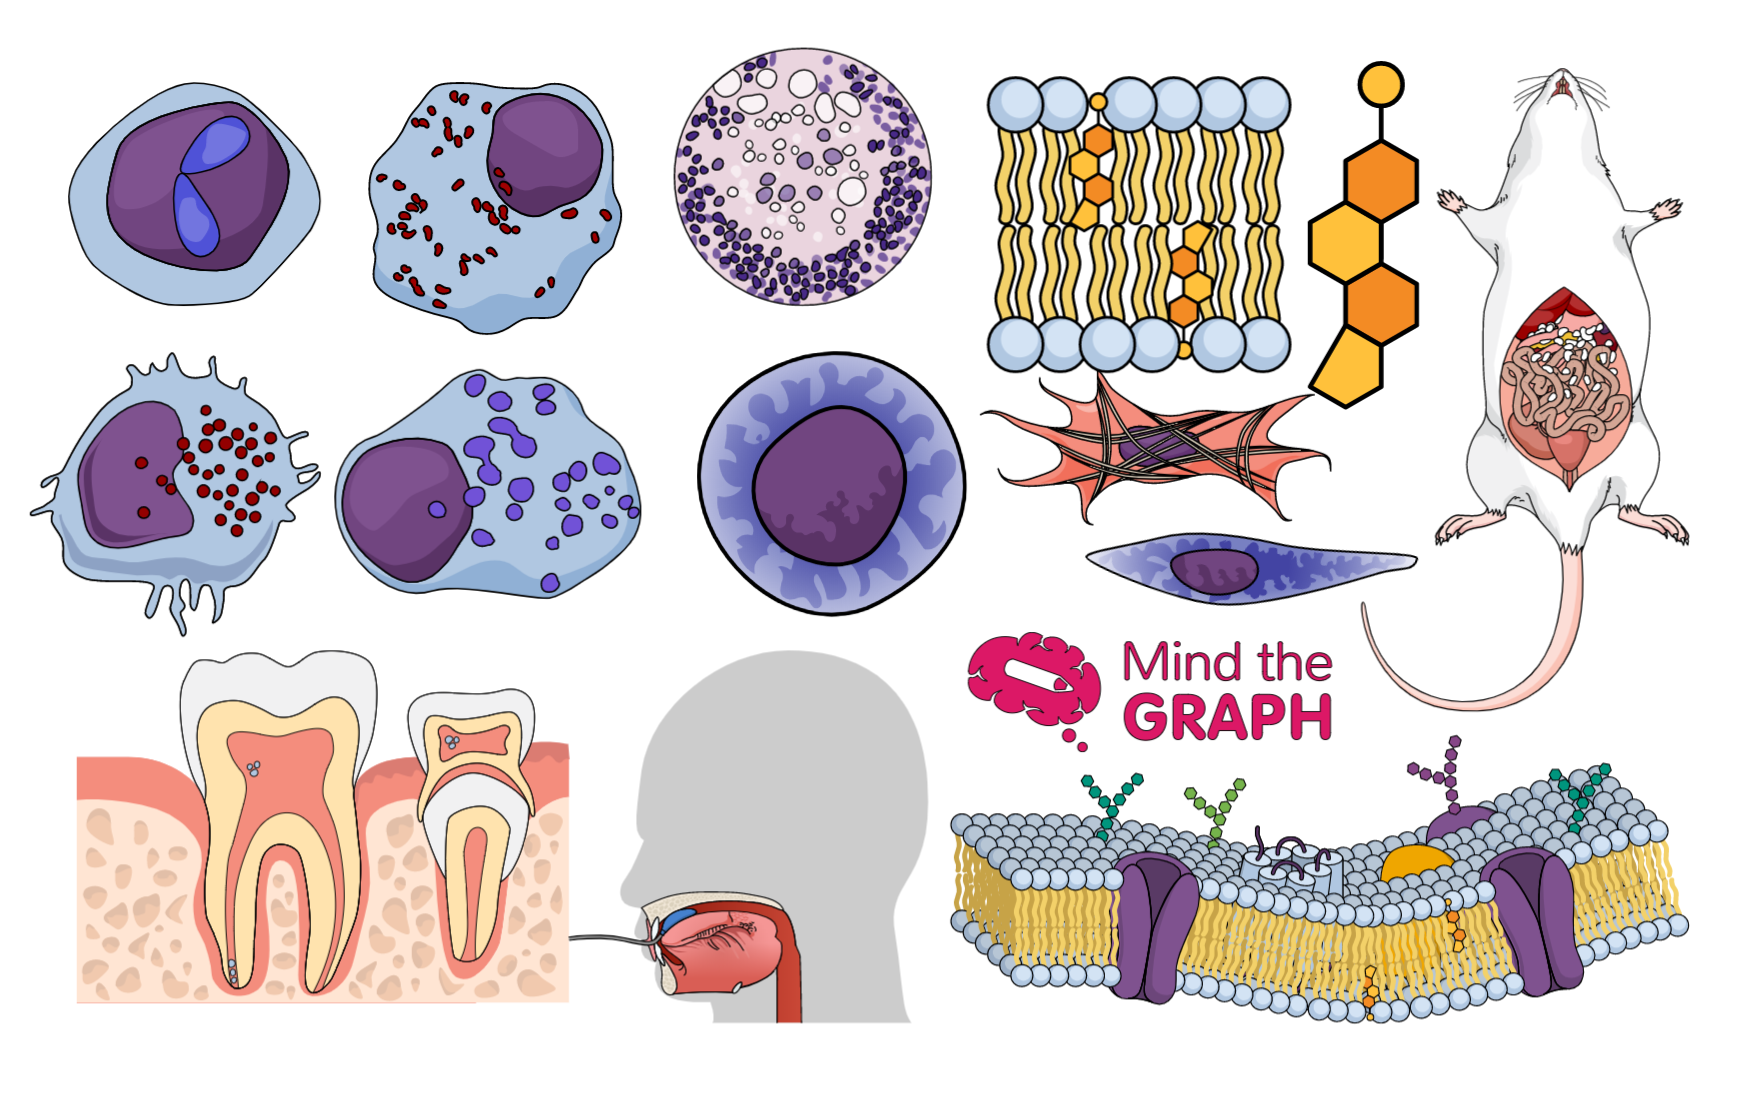
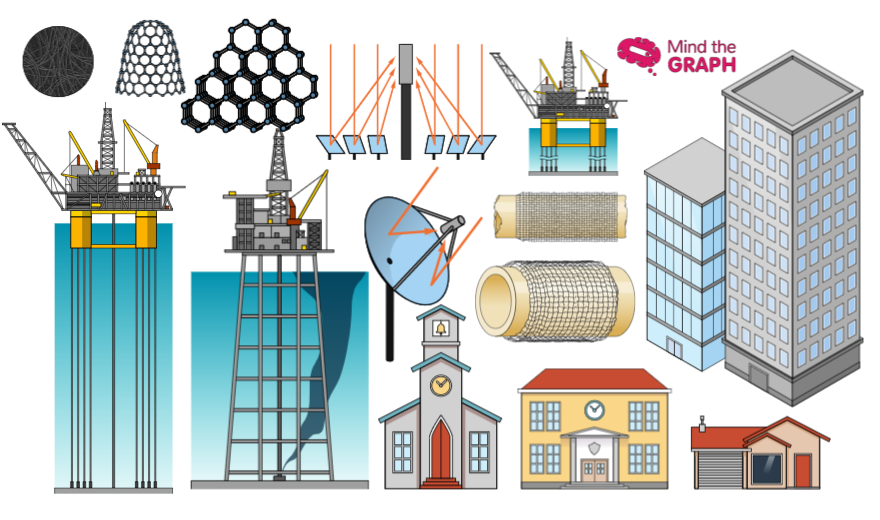
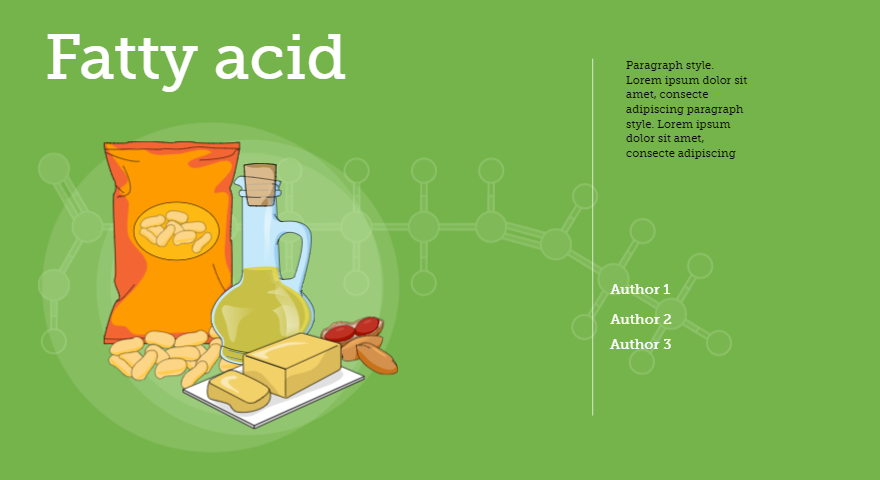
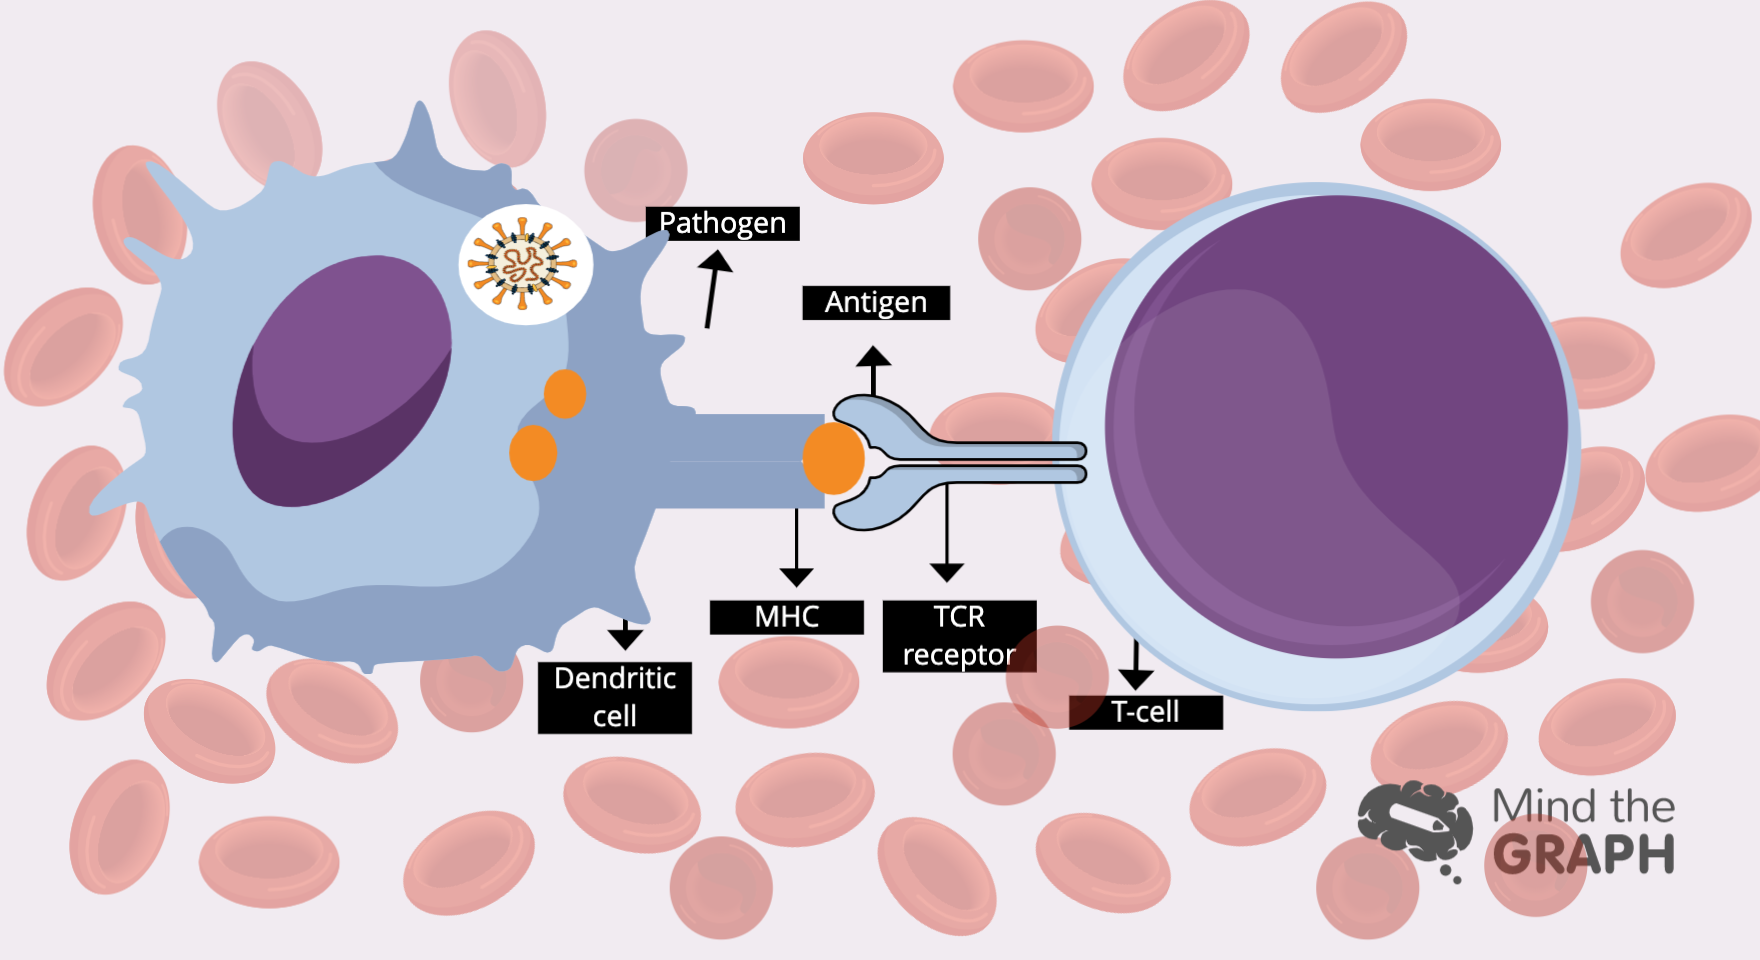
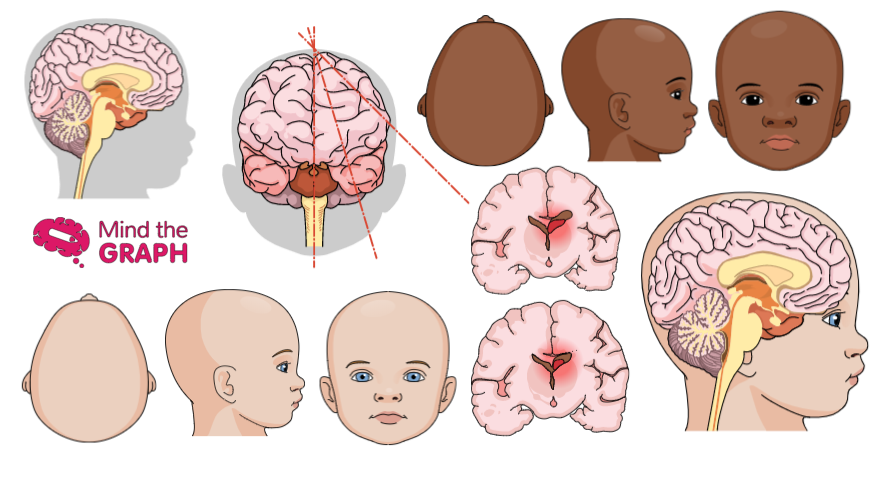
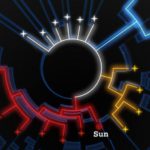
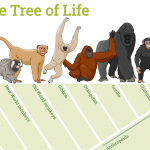
Hei på dere! Som du kanskje vet, er fredag dagen da vi deler de nye vitenskapelige illustrasjonene. Denne uken har vi lagt til flere eksklusive illustrasjoner som er tilgjengelige for alle mind the graph-brukere (inkludert gratisbrukere). Disse figurene nedenfor er et lite utvalg av det komplette biblioteket vårt. Vi har opprettet en større nettbasert database med vitenskapelige illustrasjoner. Så sjekk [...]
Durante os dias 24 e 25 de outubro de 2019, aconteceu no Sindicato das Empresas [...].
I dag har vi en gjesteforfatter - Maryam Kamal - som er en font duos designer [...].
Olá! Espero que esteja aproveitando sua sexta-feira! Estou escrevendo para trazer boas notícias: temos muitas [...]
Hallo igjen! Som du kanskje vet, legger vi hver uke til nye illustrasjoner i biblioteket vårt. [...]
Finn ut hvordan du lager et effektivt grafisk sammendrag. Denne veiledningen hjelper deg med å lage et overbevisende visuelt sammendrag som gir forskningen større gjennomslagskraft.
Hei på dere! Gleder du deg til helgen? Det gjør vi også! På fredag er det dessuten [...].
Hei, i dag kommer jeg med gode nyheter! Som du kanskje vet, tilbyr vi infografikk og [...].
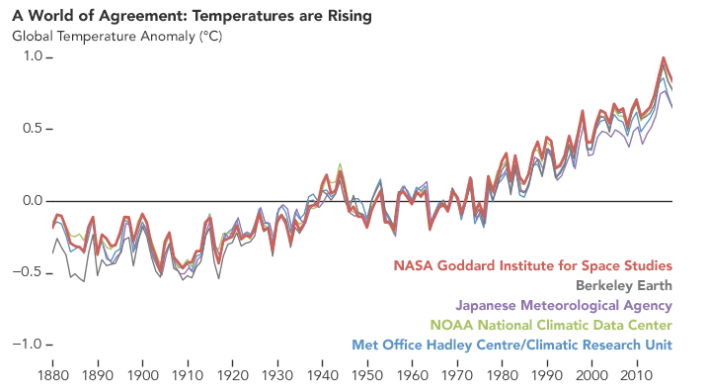
Klimaendringene er fortsatt et kontroversielt tema. Noen ganger forsvinner vitenskapelige bevis til fordel for personlige meninger og [...].
Olá! É sexta-feira novamente. Antes de falarmos sobre as expectativas para o fim de semana, [...].
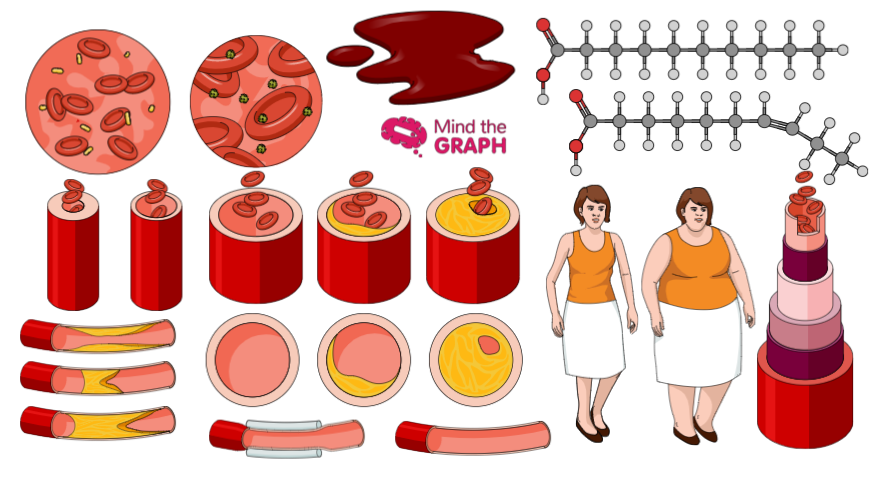
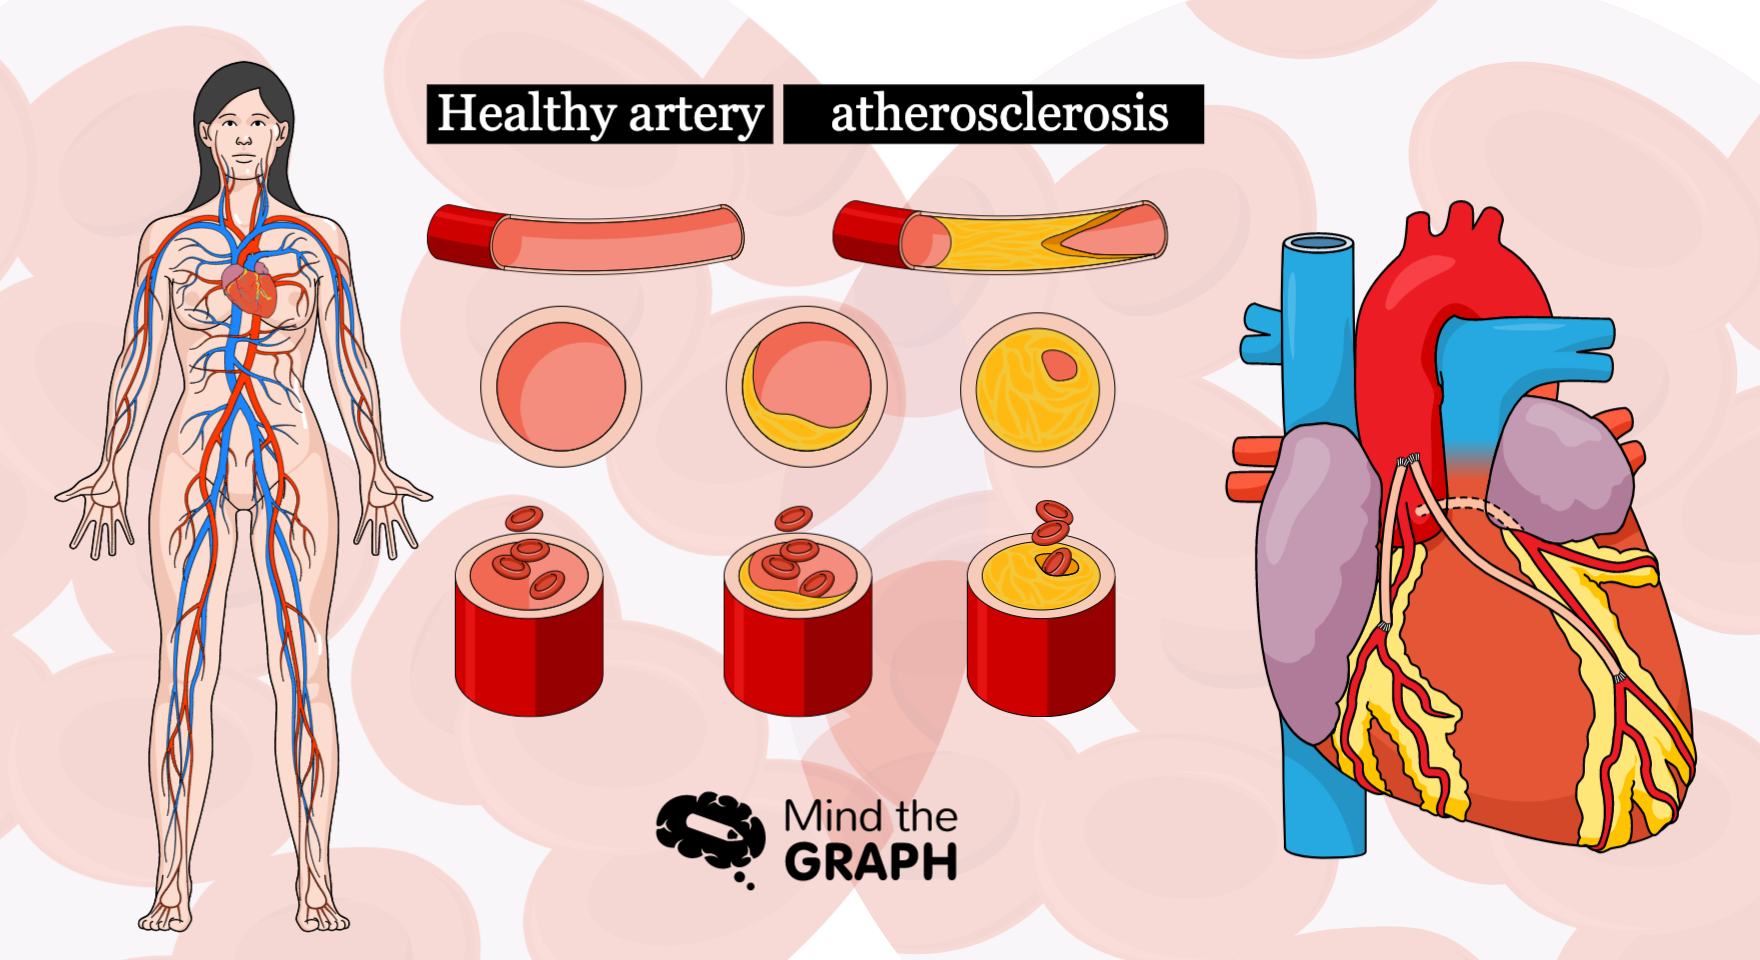
Aterosklerose er en medisinsk tilstand i sirkulasjonssystemet. Det skjer når plakk hoper seg opp i [...].
Os glóbulos brancos são responsáveis por defender nosso corpo contra ameaças, mantendo-nos vivos. Mas como [...]
Olá! Sexta é dia de mostrar o melhor da nossa semana. Como você deve saber, [...]