4 min olvasni
09/20/2019
A Mind The Graph tudományos blog célja, hogy segítsen a tudósoknak megtanulni, hogyan lehet a tudományt egyszerű módon kommunikálni.
Igen. A globális felmelegedés valós. Legalábbis a tudomány szerint. Ez a rövid válasz. De normális, hogy a globális felmelegedés elnevezéssel kapcsolatban zavarban vagyunk. Különösen akkor, amikor közeleg a tél, fázunk, és a hétvégére havazást várunk. Lássuk tehát a legújabb tudományos adatokat, hogy megértsük. 01. Éghajlat X Időjárás Ez [...]
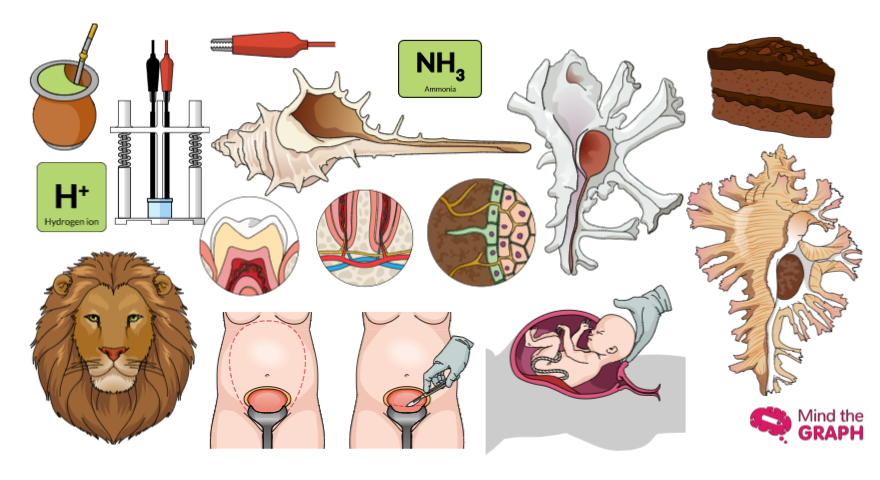
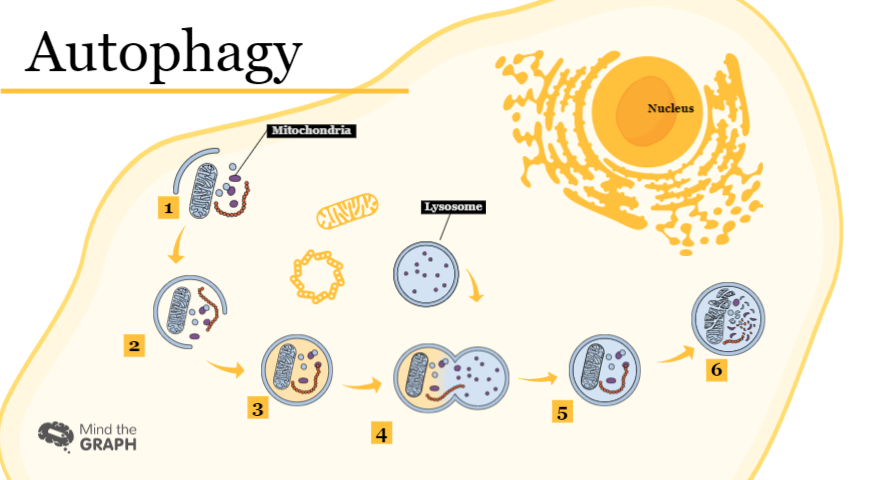
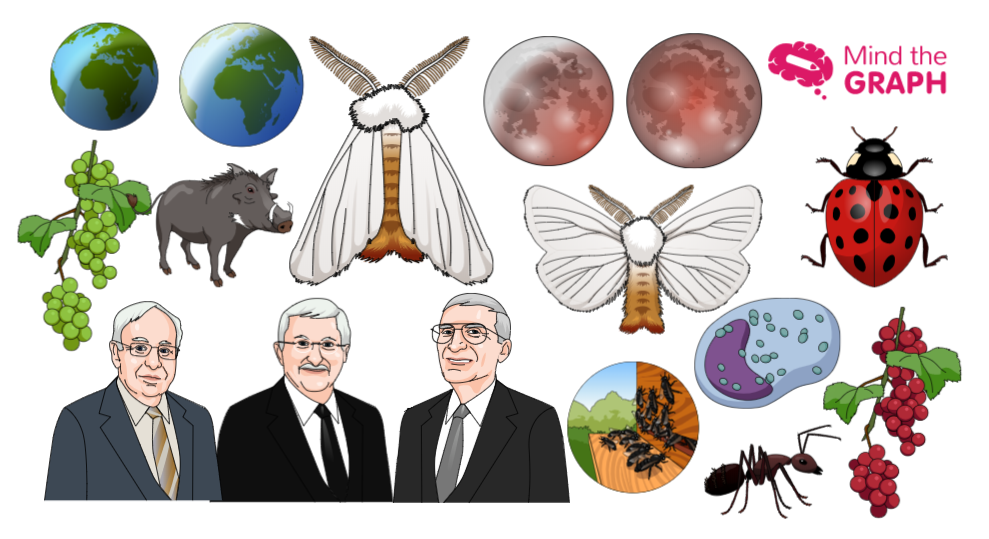
Üdvözlöm önöket. Készen állsz, hogy megnézd a hét legjobb tudományos illusztrációit? Ahogy [...]
A vizuális források nagyban hozzájárulnak a jobb tudományos kommunikációhoz. A tudományos illusztrációk jó példa [...]
Mint azt valószínűleg tudod ezen a ponton, mi vagyunk a legnagyobb könyvtár pontos [...]
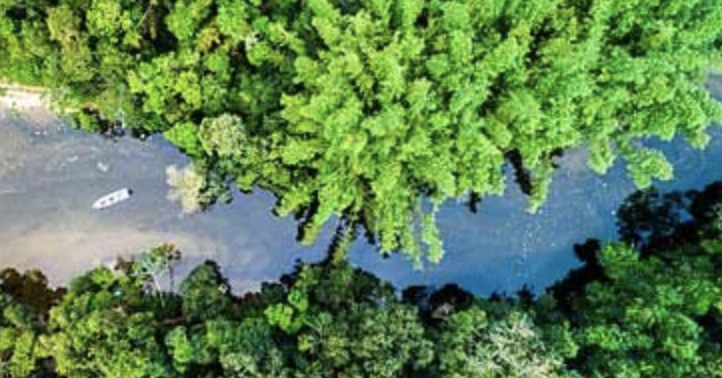
Az utolsó napok kemények voltak, igaz? Az amazóniai esőerdőben pusztító erdőtüzek trenddé váltak [...]
Escrever um artigo científico é um passo muito importante da vida científica. Afinal, você precisa [...]
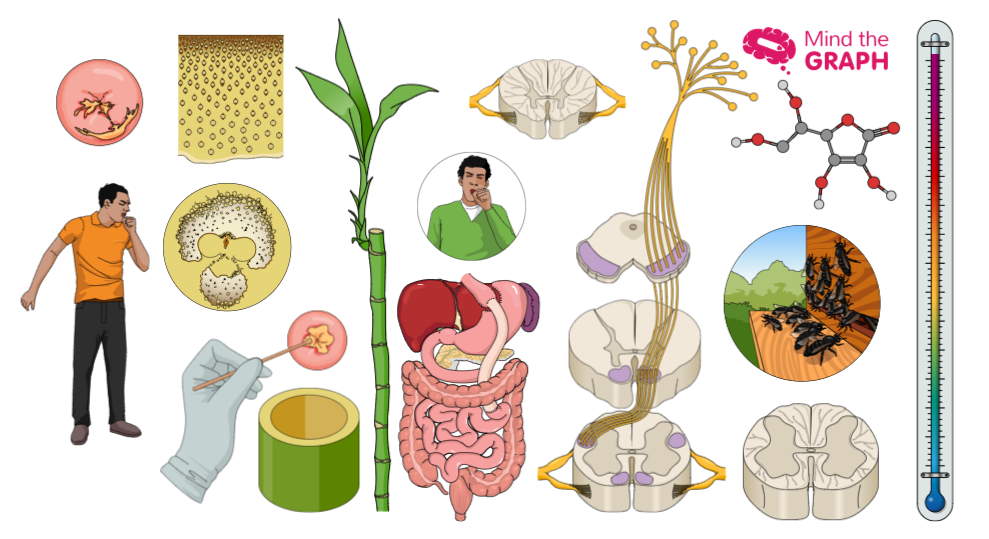
Sziasztok! Készen állsz az új tudományos illusztrációkra? Rengeteg [...]
Láthatjuk a mérhetetlen esőerdők nézi a képeket a fák tetején venni [...]
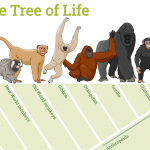
Az amazóniai esőerdő a Föld biológiailag legváltozatosabb helye. Az összes ismert [...]
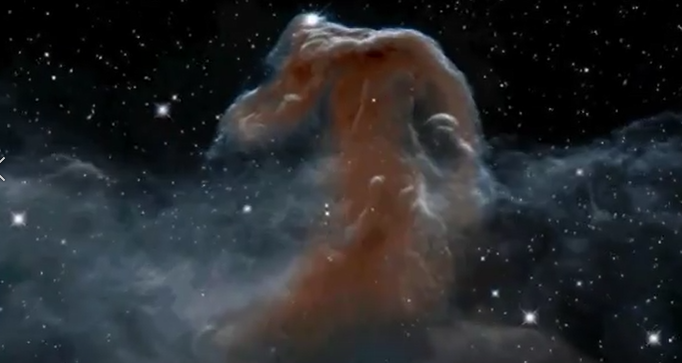
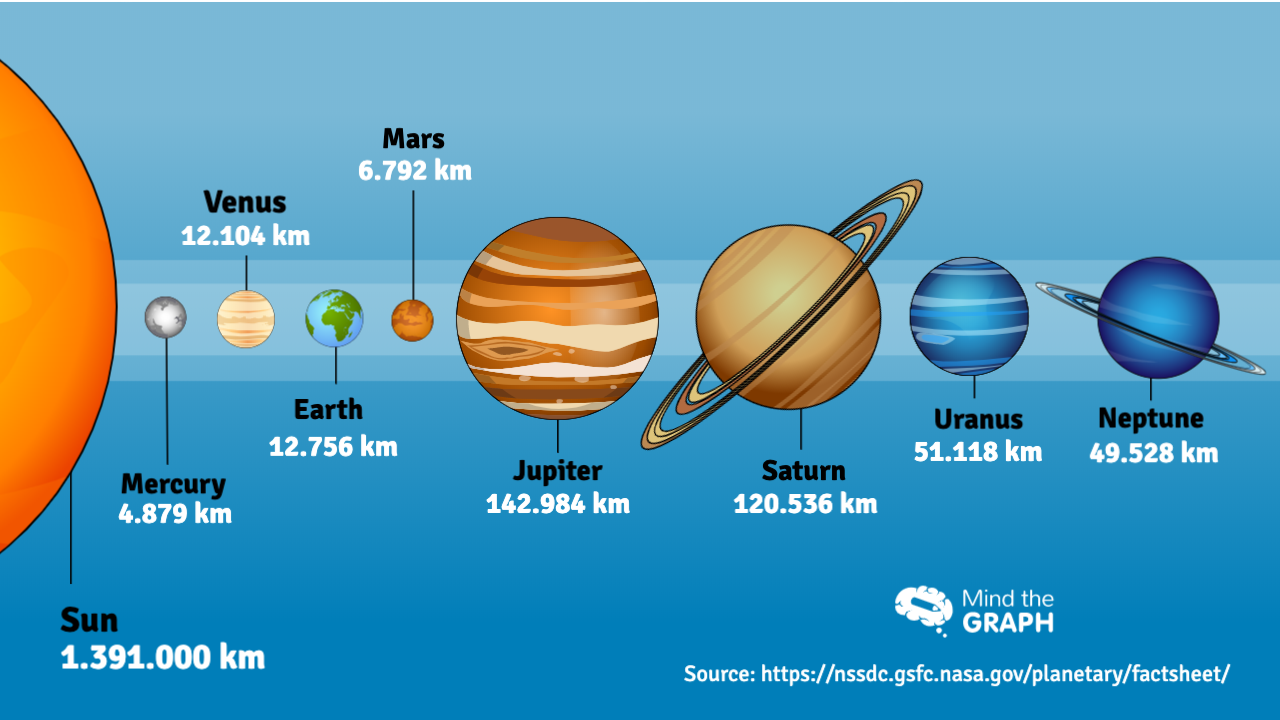
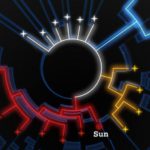
Milyen nagy és változatos az univerzum? Nos, ez még a fizika számára is nehéz kérdés. [...]
Öleld át magad, jön a hétvége! Ismét péntek van, és várjuk a [...]
Sziasztok! Új tudományos illusztrációkat hoztunk nektek! Minden pénteken megmutatjuk, hogy mi [...]
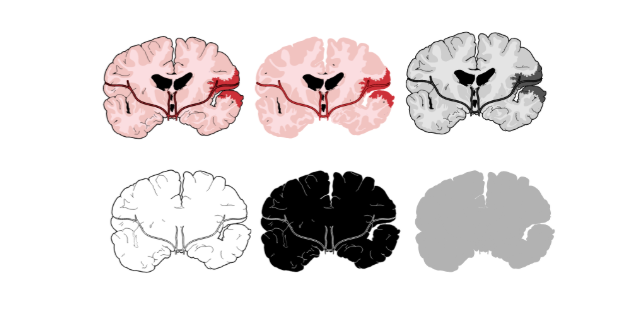
Ez a bejegyzés egy nagyon komoly és fontos témáról szól. Minden évben közel 800.000 ember [...]