3 minutos de lectura
07/29/2022
El blog científico Mind The Graph pretende ayudar a los científicos a aprender a comunicar la ciencia de forma sencilla.
En este artículo se analiza qué son los artículos revisados por pares y por qué se consideran necesarios para garantizar la calidad científica académica
Descubra qué tipo de conclusión se adapta mejor a su investigación, cómo redactarla paso a paso y los errores más comunes que debe evitar.
Conozca la posición anatómica y por qué son tan importantes para cada especie de organismo en medicina.
Descubra las múltiples formas de plagio, las mejores maneras de evitarlo y cómo determinar si su trabajo lo contiene accidentalmente.
Entender qué es el análisis post-hoc y cómo encontrar datos y patrones valiosos una vez finalizado el estudio.
Aprenda a resumir sus artículos de forma eficaz utilizando estas sencillas técnicas y las mejores prácticas del sector.
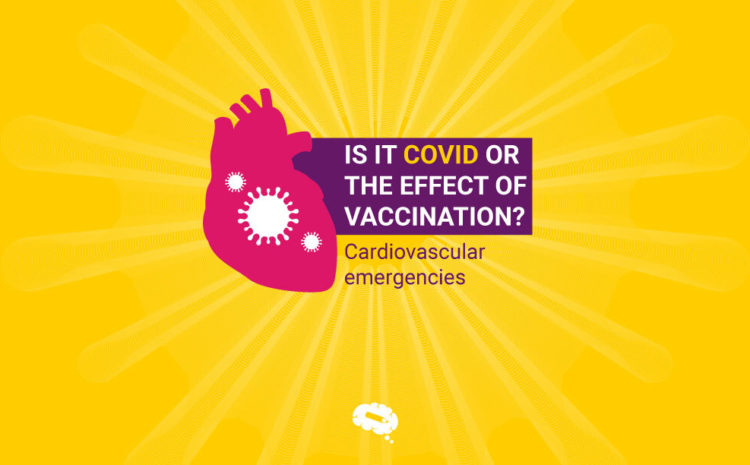
El artículo destacado habla de varias complicaciones cardíacas causadas por COVID-19 durante su ciclo de infección y sus efectos a largo plazo.
Mejore su informe de investigación y aprenda a elaborar una hipótesis precisa y completa para su investigación.
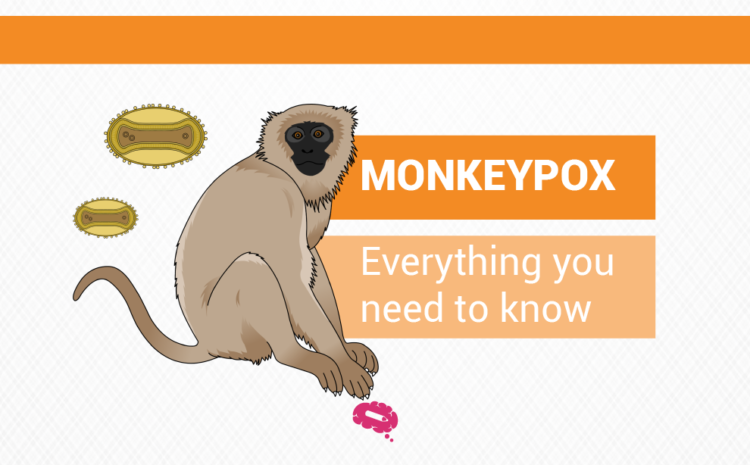
En este artículo, veremos qué es la viruela del mono y cómo identificar sus síntomas y recomendar medidas para prevenirla.
Comprender cómo realizar una investigación de análisis conceptual más precisa y detallada para convertirla en un concepto más concreto.
Este artículo explicará cuál es el mejor enfoque para comunicar la información a su público incluyendo las cifras en un trabajo de investigación.
A continuación le ofrecemos una guía para ayudarle a redactar un buen planteamiento del problema, comprendiendo la importancia de sus cualidades, elementos y marco.
Las diapositivas presentan la esencia del contenido de forma muy ventajosa si se aprovechan los consejos probados en materia de formato.